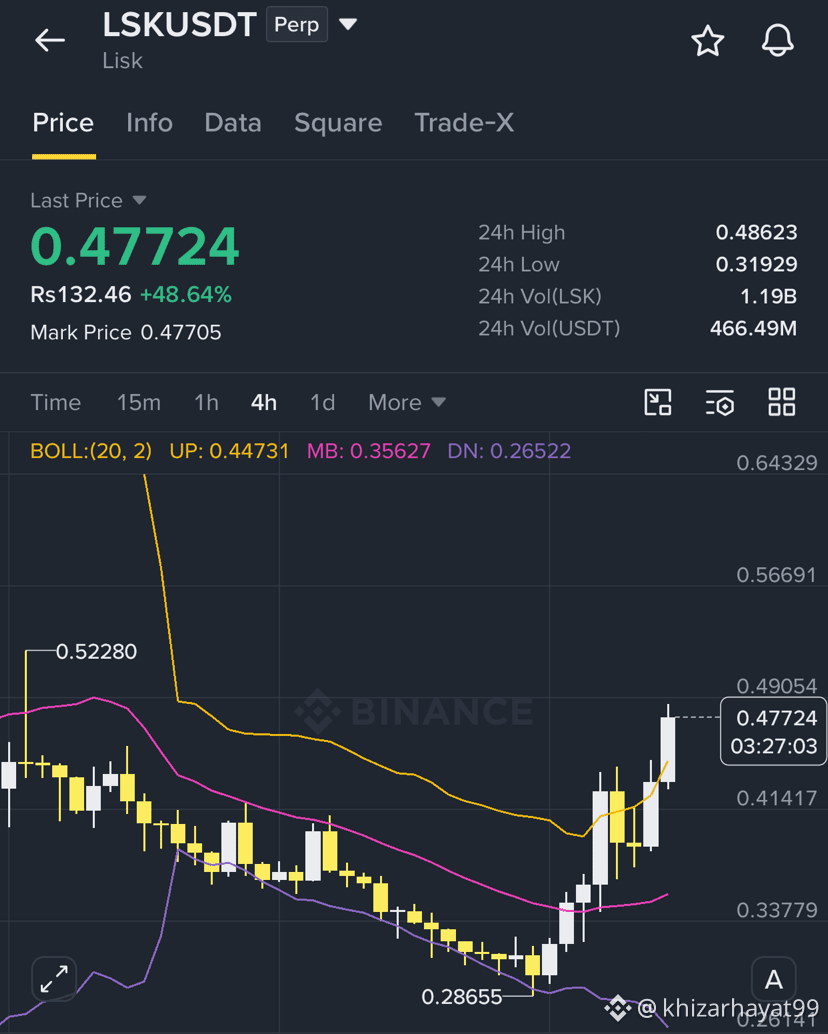
Analyzing a potential bullish setup on the 4-hour (4H) timeframe for $LSK /USDT around the 0.47 price region requires evaluating structural confluence, risk parameters, and market context.
📊 4H Bullish Market Structure Analysis
Structural Context: When an asset approaches a key area like 0.47 on the 4H chart, a valid bullish setup typically relies on a shift in market structure (MSS)—such as breaking a recent lower high to form a higher low (HL) and higher high (HH).
Moving Average Confluence: In sustained 4H bullish trends, price action frequently respects dynamic support levels like the 50-period EMA or 200-period EMA. Ensuring price is holding above these indicators helps confirm that buyers maintain control.
Support & Demand Zones: Look for a reaction off an established local demand zone or a retested breakout level (such as a previous resistance turned support) near the 0.45–0.47 range.
🛠️ Sample Risk-Managed Trade Blueprint
If you are planning to structure a trade around this setup, execution relies heavily on defined risk boundaries rather than chasing momentum blindly.
Estimated Entry Zone: 0.4550 – 0.4700 (waiting for a local consolidation or minor pullback confirmation on lower timeframes)
Invalidation / Stop-Loss (SL): Below the recent 4H swing low or structural invalidation point (typically under ~0.4050–0.4100 depending on your risk tolerance) to protect against a structural breakdown.
Take-Profit (TP) Targets:
TP1: 0.4900 (Immediate local liquidity / previous minor high)
TP2: 0.5130 (Mid-range resistance expansion)
Binance
TP3: 0.5480+ (Higher timeframe liquidity objective)
Disclaimer: Cryptocurrency trading involves substantial risk of loss and is not suitable for every investor. Market structures can shift rapidly due to volatility or broader market (BTC) correlation. Always practice proper risk management (e.g., risking no more than 1–2% of your capital per trade) and perform your own due diligence.
📊 4H Bullish Market Structure Analysis
Structural Context: When an asset approaches a key area like 0.47 on the 4H chart, a valid bullish setup typically relies on a shift in market structure (MSS)—such as breaking a recent lower high to form a higher low (HL) and higher high (HH).
Moving Average Confluence: In sustained 4H bullish trends, price action frequently respects dynamic support levels like the 50-period EMA or 200-period EMA. Ensuring price is holding above these indicators helps confirm that buyers maintain control.
Support & Demand Zones: Look for a reaction off an established local demand zone or a retested breakout level (such as a previous resistance turned support) near the 0.45–0.47 range.
🛠️ Sample Risk-Managed Trade Blueprint
If you are planning to structure a trade around this setup, execution relies heavily on defined risk boundaries rather than chasing momentum blindly.
Estimated Entry Zone: 0.4550 – 0.4700 (waiting for a local consolidation or minor pullback confirmation on lower timeframes)
Invalidation / Stop-Loss (SL): Below the recent 4H swing low or structural invalidation point (typically under ~0.4050–0.4100 depending on your risk tolerance) to protect against a structural breakdown.
Take-Profit (TP) Targets:
TP1: 0.4900 (Immediate local liquidity / previous minor high)
TP2: 0.5130 (Mid-range resistance expansion)
Binance
TP3: 0.5480+ (Higher timeframe liquidity objective)
Disclaimer: Cryptocurrency trading involves substantial risk of loss and is not suitable for every investor. Market structures can shift rapidly due to volatility or broader market (BTC) correlation. Always practice proper risk management (e.g., risking no more than 1–2% of your capital per trade) and perform your own due diligence.