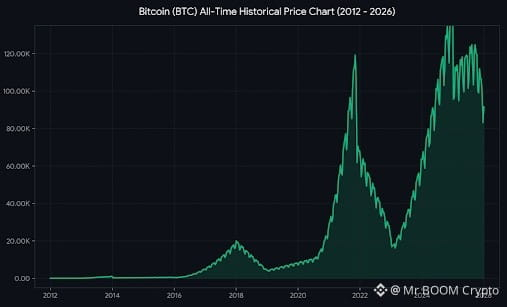
#BTCBitcoin started trading in the single digits, experiencing its first small spikes toward $1,000. On a linear scale, this entire period is visually flat due to the explosive growth in later years.
Context: Institutional interest was nonexistent; the ecosystem was forming around retail and technical enthusiasts.
The 2017 Breakthrough & Crypto Winter (2017 – 2019)
Description: Bitcoin surged exponentially from under $1,000 to nearly $20,000 in December 2017, a major turning point for global recognition.
Result: A strict correction followed, leading to a bottom near $3,000 in 2019, forming a 'higher low' compared to the pre-2017 cycle.
Institutional Wave & Pandemic Expansion (2020 – 2021)
Description: Following the 2020 Halving, macro liquidity, inflation fears, and initial corporate adoption drove Bitcoin to consecutive peaks of $64,000 and then $69,000 in 2021.
Market Dynamic: Massive capital inflows from traditional finance (TradFi) became a primary driver.
ETF Approval & Structural Shift (2024 – 2026)
Description: The approval of Spot Bitcoin ETFs in the US and the 4th Halving event generated a powerful supply/demand shock. Bitcoin shattered previous highs, crossing $100,000 for the first time.
Projected Status: The final phase shown on the chart illustrates high-level volatility above six figures, establishing a new macro baseline in 2026.
Context: Institutional interest was nonexistent; the ecosystem was forming around retail and technical enthusiasts.
The 2017 Breakthrough & Crypto Winter (2017 – 2019)
Description: Bitcoin surged exponentially from under $1,000 to nearly $20,000 in December 2017, a major turning point for global recognition.
Result: A strict correction followed, leading to a bottom near $3,000 in 2019, forming a 'higher low' compared to the pre-2017 cycle.
Institutional Wave & Pandemic Expansion (2020 – 2021)
Description: Following the 2020 Halving, macro liquidity, inflation fears, and initial corporate adoption drove Bitcoin to consecutive peaks of $64,000 and then $69,000 in 2021.
Market Dynamic: Massive capital inflows from traditional finance (TradFi) became a primary driver.
ETF Approval & Structural Shift (2024 – 2026)
Description: The approval of Spot Bitcoin ETFs in the US and the 4th Halving event generated a powerful supply/demand shock. Bitcoin shattered previous highs, crossing $100,000 for the first time.
Projected Status: The final phase shown on the chart illustrates high-level volatility above six figures, establishing a new macro baseline in 2026.