

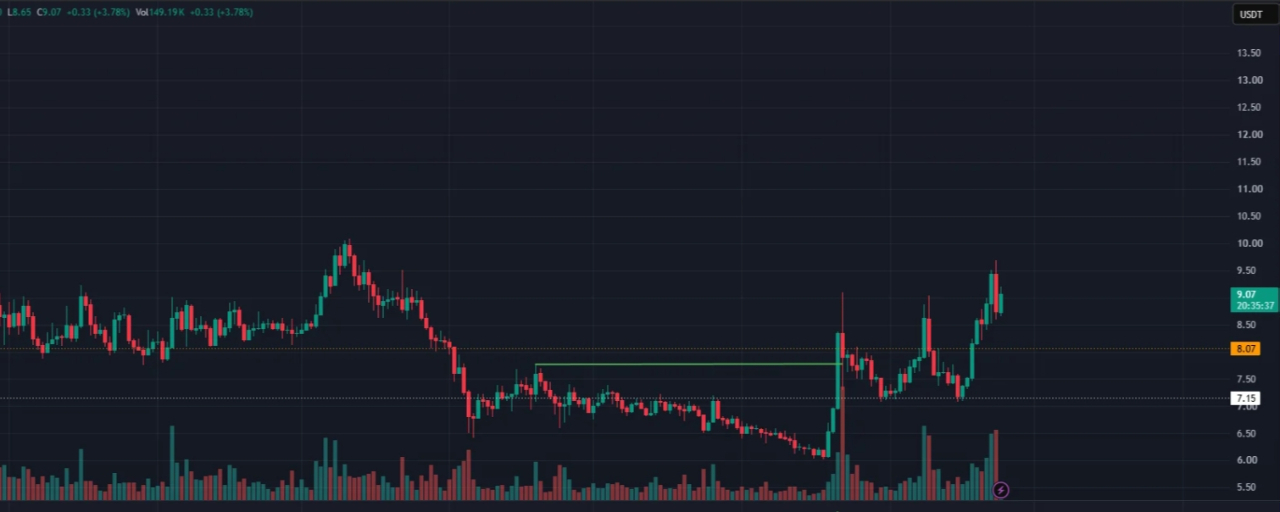

What caught my attention with ETC is not the 11% correction.
It is what happened before the drop.
Ethereum Classic rallied around 36.5% in less than a week and pushed from roughly $7.09 toward $9.68 before sellers stepped in. A move that fast was always going to attract profit taking.
The broader market also added pressure. Bitcoin dropped around 2.1% while ETH fell around 2.5%. More than $547M in crypto positions were liquidated in 24 hours with long positions making up more than $454M.
ETC itself saw only around $802K in long liquidations.
So I would not treat the correction as proof that the larger structure has already turned bearish.
The daily chart still has an important higher low structure.
ETC broke above the old $7.77 lower high in August and then successfully tested the $7.15 area twice. Buyers used those tests to push price toward new highs.
That is the part I would keep watching.
The current problem is $9.20.
ETC broke below this area quickly after reaching $9.68 and that makes $9.20 a clear short term supply zone.
If buyers reclaim $9.20 and hold it then the correction starts looking more like a reset after a fast rally.
If they fail then the next areas I would watch are $8.39 and $8.08.
Below that comes $7.64 which lines up with the 78.6% retracement.
The bigger line in the sand is still $7.09.
As long as ETC holds above that level the higher timeframe bullish structure remains intact.
For me the interesting question is not whether ETC can bounce immediately.
It is whether buyers can defend the correction without losing the structure they created during the August breakout.
$9.20 is the short term level.
$7.09 is the bigger one.
Everything between them is basically a test of how much of the recent rally was real demand and how much was momentum.