$DOGE
$Doge Tests a Key Breakout Level: What the Charts Show and What Could Go Wrong
Dogecoin recently closed above a level that buyers had failed to hold for months. The real question now is whether that level survives a retest.
MARKET OVERVIEW
Bitcoin rebounded from about $75,600 on Sep 15 to a high near $87,400 on Sep 21, then pulled back to roughly $84,300. The recovery came despite a Fed rate hike and the failure of the CLARITY Act in the Senate. U.S. spot Bitcoin ETFs saw a $999M inflow day on Sep 21, the largest since October 2025. Macro risk remains, with PCE data on Sep 30 and the jobs report on Oct 2.
.TECHNICAL ANALYSIS
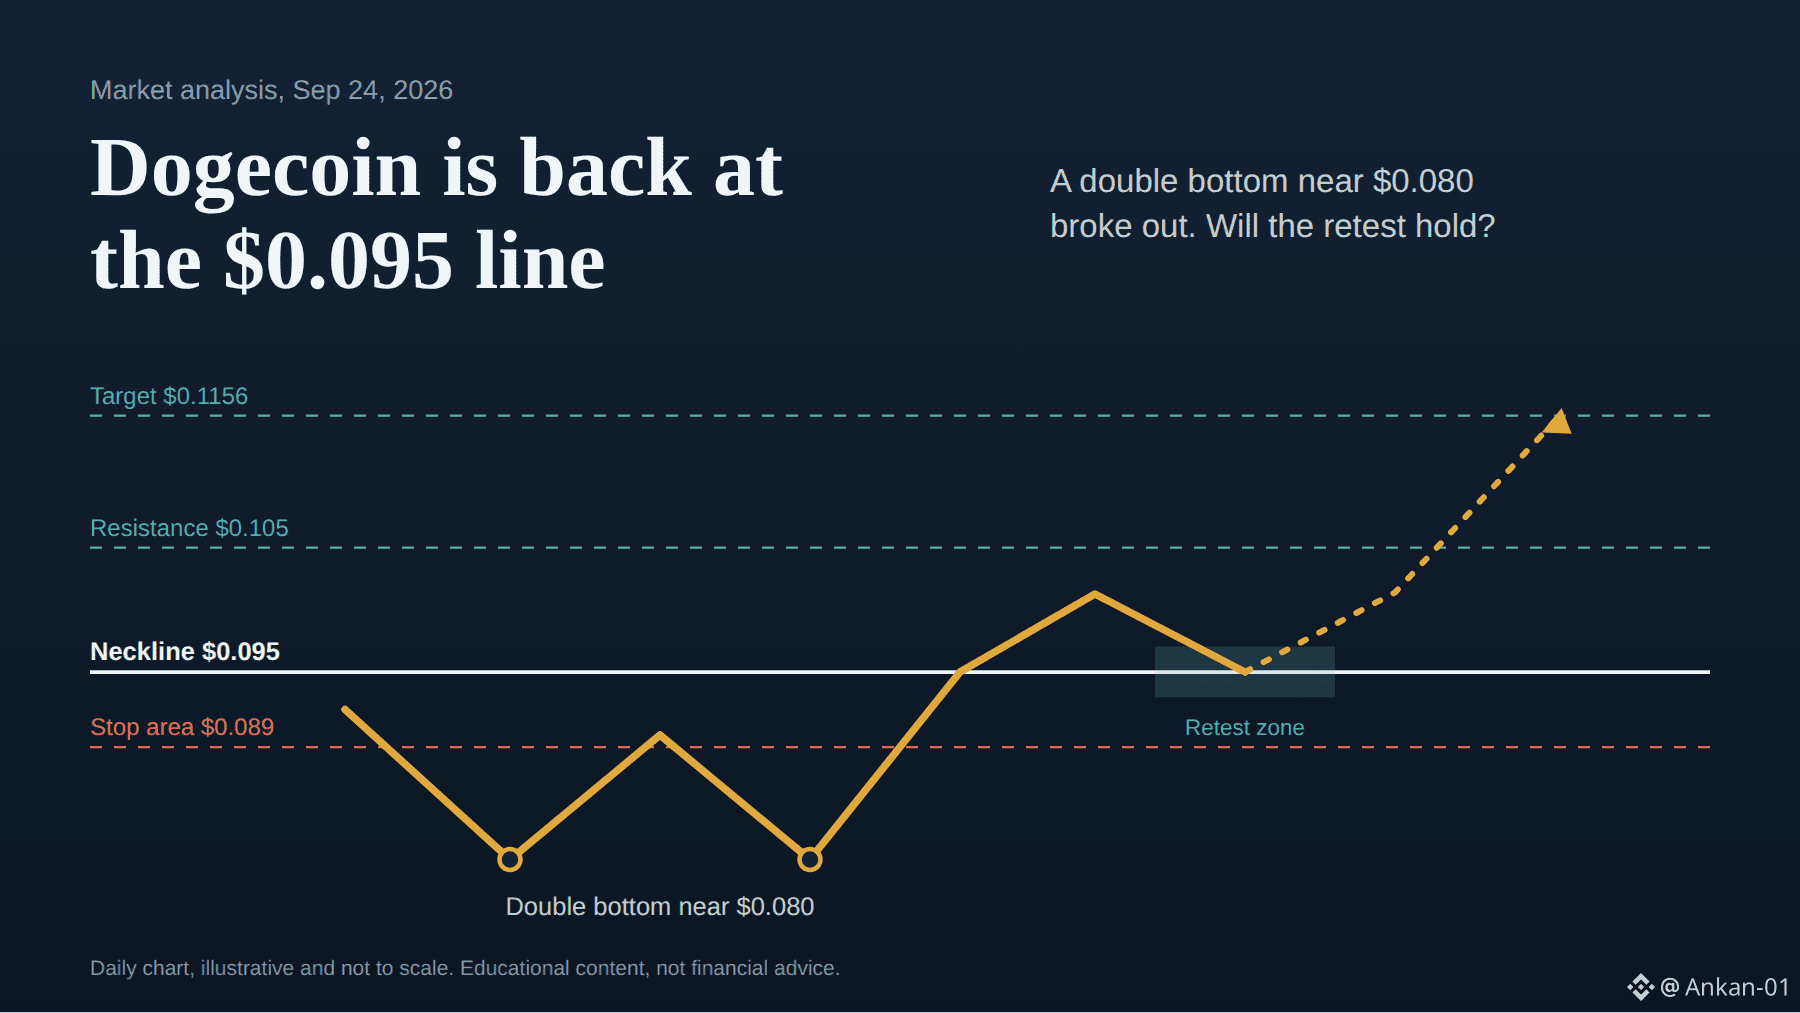
On the daily chart, DOGE formed a double bottom near $0.080 in late August and mid-September. On Sep 22 it closed above the $0.095 neckline on volume about 47% above its 20-day average. Derivatives activity also picked up, with open interest around $1.66B.
KEY LEVELS
- Support: $0.095 (neckline), $0.0839, $0.0782
- Resistance: about $0.105, then $0.1156 (pattern target)
RISK FACTORS
- Breakouts that happen in a single session often fail on the first retest.
- Leverage can amplify moves in both directions.
- DOGE ETFs are still very small.
- Macro or regulatory headlines can change the picture quickly.
- If Bitcoin loses its recent gains, meme coins usually fall harder.
TRADE SETUP AND INVALIDATION
One approach is to watch for a retest of the $0.093-$0.097 zone and see whether it holds. A stop near $0.089 would limit risk, and $0.105 and $0.1156 are possible upside references. A daily close below $0.095 invalidates the pattern. Meme coins move fast, so these levels can fail quickly.
FINAL MARKET VIEW
The structure has improved, but the setup is unconfirmed until the retest holds.
#DOGE #DOGECOİN #Bitcoin #CryptoAnalysis #MemeCoins
$Doge Tests a Key Breakout Level: What the Charts Show and What Could Go Wrong
Dogecoin recently closed above a level that buyers had failed to hold for months. The real question now is whether that level survives a retest.
MARKET OVERVIEW
Bitcoin rebounded from about $75,600 on Sep 15 to a high near $87,400 on Sep 21, then pulled back to roughly $84,300. The recovery came despite a Fed rate hike and the failure of the CLARITY Act in the Senate. U.S. spot Bitcoin ETFs saw a $999M inflow day on Sep 21, the largest since October 2025. Macro risk remains, with PCE data on Sep 30 and the jobs report on Oct 2.
.TECHNICAL ANALYSIS
On the daily chart, DOGE formed a double bottom near $0.080 in late August and mid-September. On Sep 22 it closed above the $0.095 neckline on volume about 47% above its 20-day average. Derivatives activity also picked up, with open interest around $1.66B.
KEY LEVELS
- Support: $0.095 (neckline), $0.0839, $0.0782
- Resistance: about $0.105, then $0.1156 (pattern target)
RISK FACTORS
- Breakouts that happen in a single session often fail on the first retest.
- Leverage can amplify moves in both directions.
- DOGE ETFs are still very small.
- Macro or regulatory headlines can change the picture quickly.
- If Bitcoin loses its recent gains, meme coins usually fall harder.
TRADE SETUP AND INVALIDATION
One approach is to watch for a retest of the $0.093-$0.097 zone and see whether it holds. A stop near $0.089 would limit risk, and $0.105 and $0.1156 are possible upside references. A daily close below $0.095 invalidates the pattern. Meme coins move fast, so these levels can fail quickly.
FINAL MARKET VIEW
The structure has improved, but the setup is unconfirmed until the retest holds.
#DOGE #DOGECOİN #Bitcoin #CryptoAnalysis #MemeCoins