

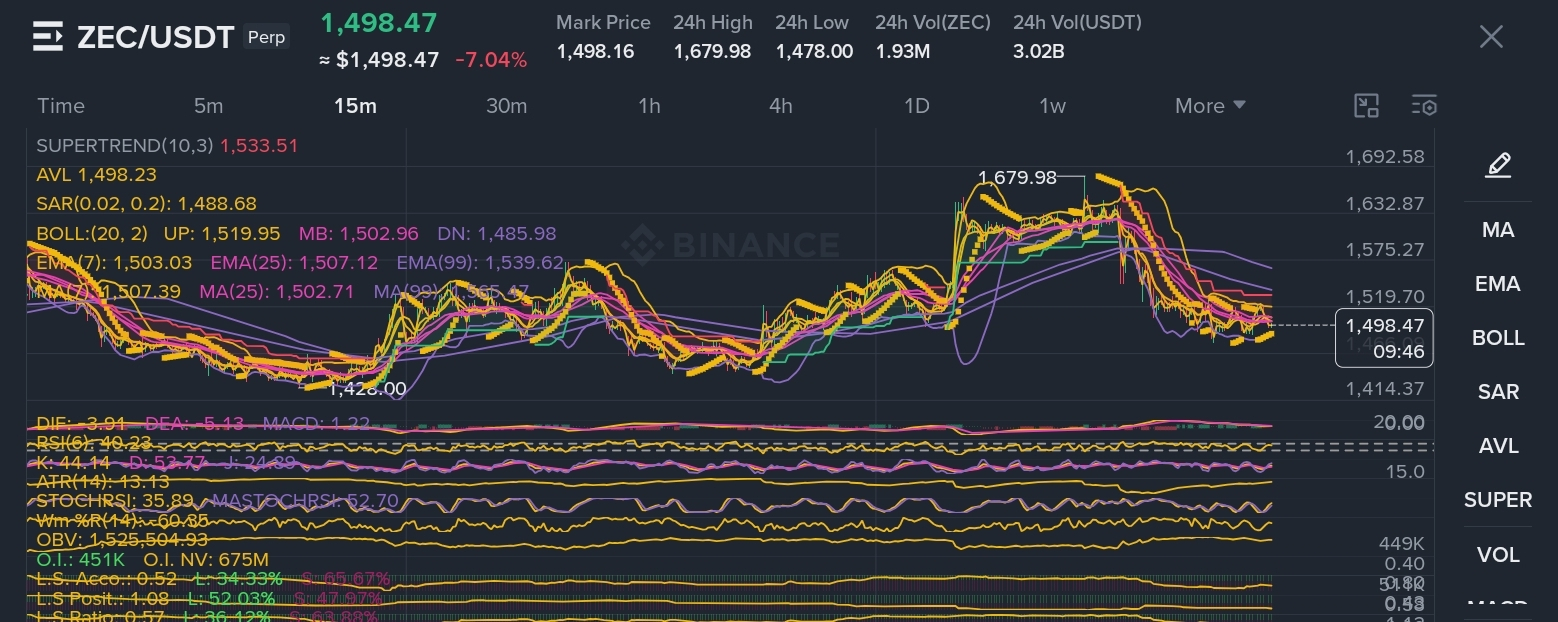

Zcash (ZEC) is trading around $1,499, down roughly 7% over 24 hours, after facing a sharp rejection from the $1,680 area.
On the 15-minute chart, RSI is around 42, while MACD is showing early signs of recovery. However, price remains below several short-term moving averages, keeping near-term momentum cautious.
The 1H chart is weaker, with RSI near 37 and MACD still in negative territory. This suggests sellers remain active, although the RSI is approaching a relatively weak zone.
On the 4H timeframe, RSI is around 36 and KDJ is deeply compressed, indicating that selling pressure has become significant. A sustained recovery above the $1,530–$1,560 region would be important for improving the short-term structure.
Meanwhile, the daily chart remains structurally bullish. ZEC is still trading well above its 25-day and 99-day averages, despite the recent pullback.
Key levels to watch
🔹 Support: $1,480, then $1,430
🔹 Resistance: $1,530–$1,560
🔹 Major resistance: $1,630–$1,680
Bottom line: ZEC is currently in a short-term correction within a much stronger higher-timeframe uptrend. The next decisive move around $1,480 support and $1,530–$1,560 resistance could provide clearer direction.
This is technical analysis based on the charts shown, not financial advice. Always manage risk carefully in leveraged markets.
#ZEC #Zcash #CryptoAnalysis #BinanceSquare #Trading