


📊 Bitcoin $BTC Technical Analysis — September 24, 2026
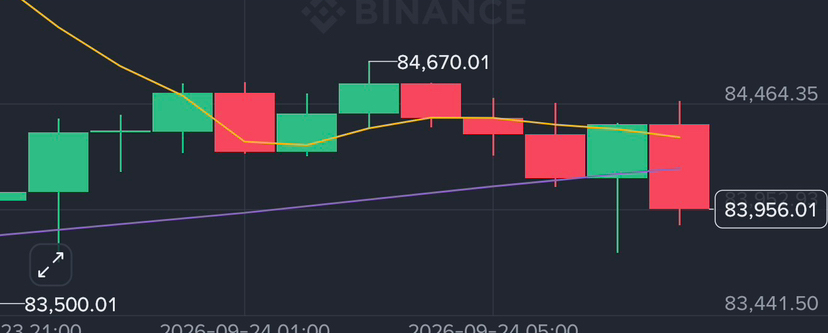
Bitcoin is facing selling pressure on the 1-hour chart, with BTC trading around $83,956, down approximately 3.27%. The chart shows price struggling below several key moving averages, suggesting that short-term momentum remains under pressure.
🔴 Key Levels
Current Price: $83,956
24H High: $87,278
24H Low: $83,500
Resistance: $84,300–$84,670
Next Resistance: $85,100+
Key Support: $83,500
Lower Support: Around $83,440
📉 Market Structure
$BTC is currently trading below the MA(7) at $84,303, MA(25) at $85,108, and slightly below the MA(99) at $84,154. This keeps the short-term setup cautious.
A break and hold above $84,300–$84,670 could indicate improving momentum, while losing $83,500 would put additional downside pressure on the chart.

⚠️ Trade carefully: Volatility is elevated, so confirmation and risk management are important.
#BitcoinAnalysis #CryptoTrading #BTC