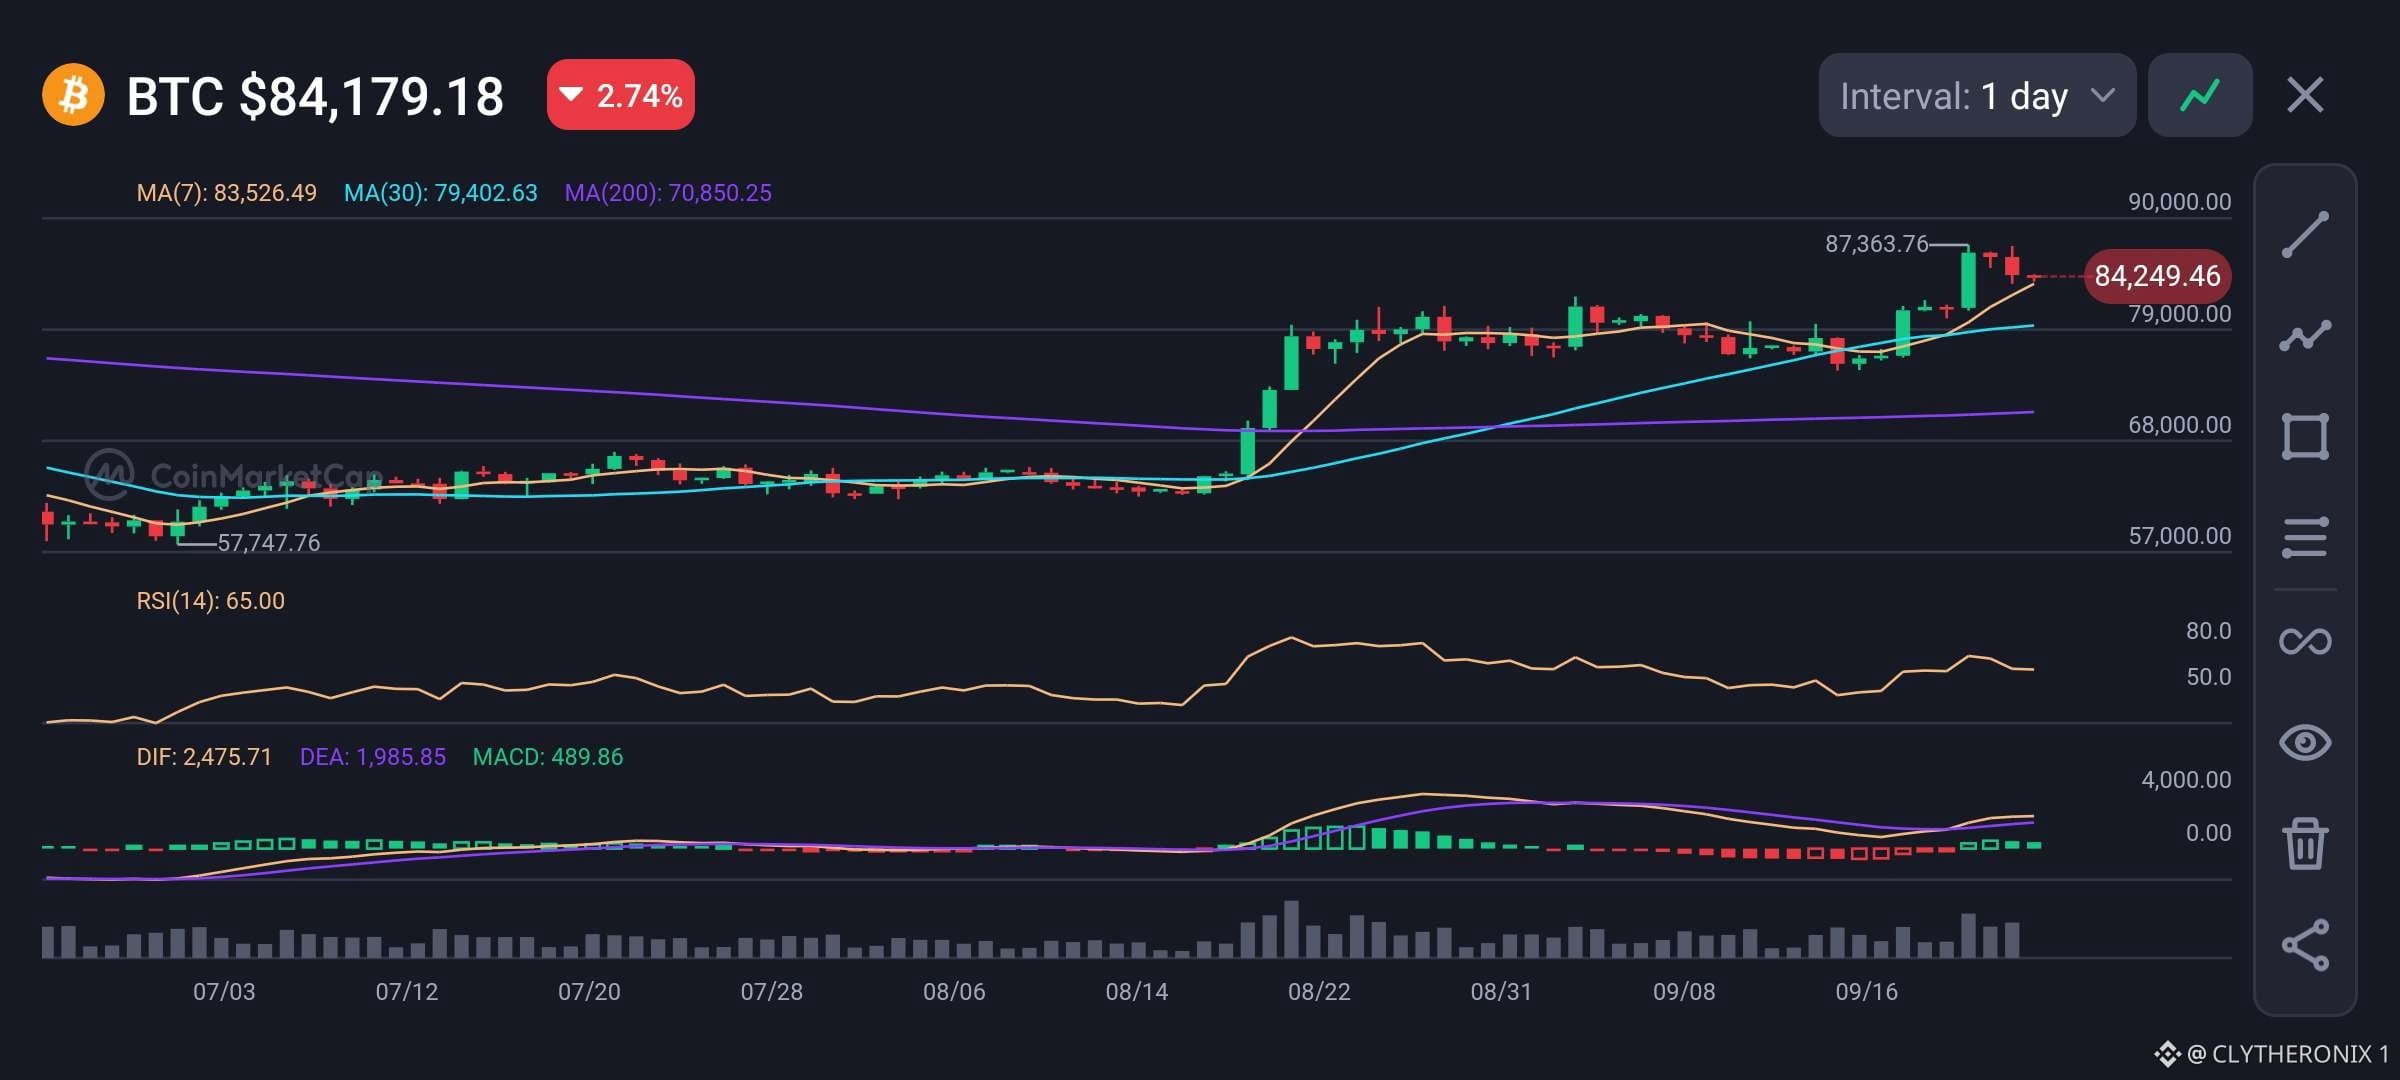
Bitcoin trades at $84,179.18 after a 2.74% price drop from its recent high of $87,363.76. The main trend stays strongly bullish because the price remains above key support lines.
The 7 day Moving Average sits at $83,526.49, the 30-day Moving Average is at $79,402.63, and the 200-day Moving Average is at $70,350.25.
Now, looking at the chart of $BTC, the short-term support is near the 7 day line at $83,500, while the main resistance is at $87,360.
The 14 period RSI is at 65.00, which shows strong buying momentum without being overbought.
The MACD indicator remains positive with DIF at 2,475.71 above DEA at 1,985.85, giving a green MACD value of 489.86.
Therefore, if buyers hold the $83,500 support level, Bitcoin can move back up toward $87,363. However, dropping below this level could push the price down to test $79,400.
#BTC Price Analysis#
The 7 day Moving Average sits at $83,526.49, the 30-day Moving Average is at $79,402.63, and the 200-day Moving Average is at $70,350.25.
Now, looking at the chart of $BTC, the short-term support is near the 7 day line at $83,500, while the main resistance is at $87,360.
The 14 period RSI is at 65.00, which shows strong buying momentum without being overbought.
The MACD indicator remains positive with DIF at 2,475.71 above DEA at 1,985.85, giving a green MACD value of 489.86.
Therefore, if buyers hold the $83,500 support level, Bitcoin can move back up toward $87,363. However, dropping below this level could push the price down to test $79,400.
#BTC Price Analysis#