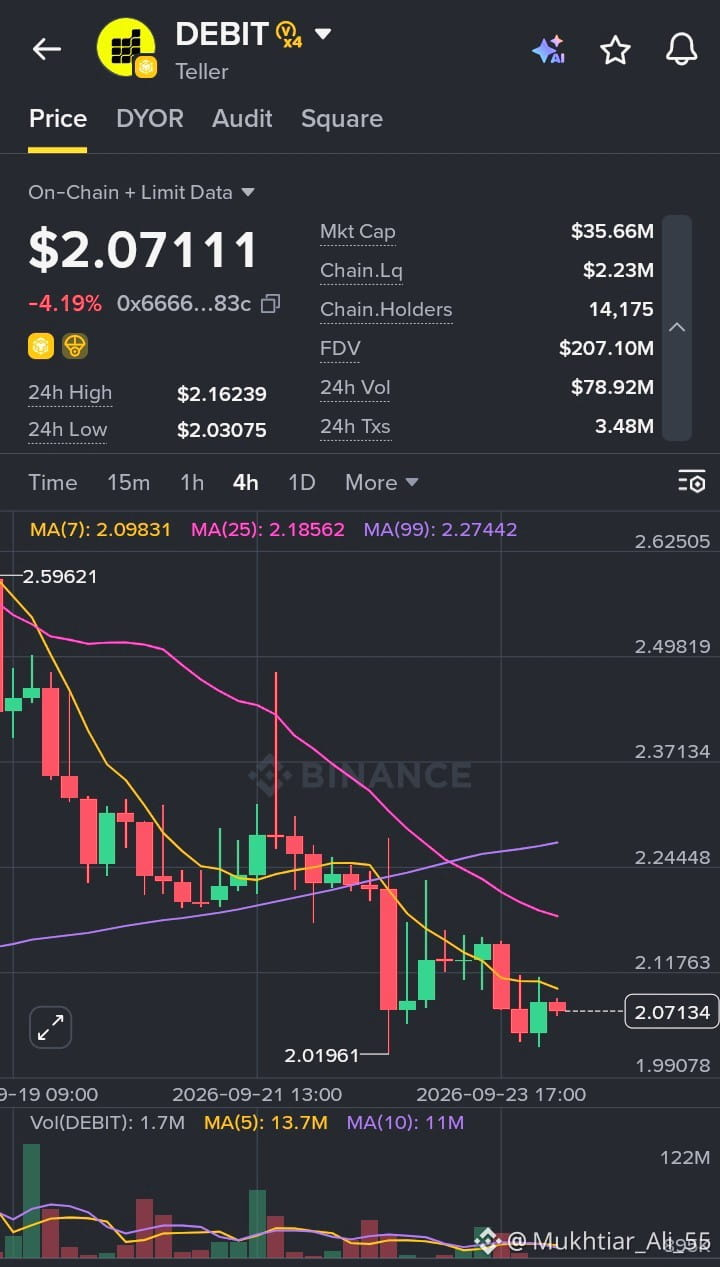
🚨 DEBIT ($DEBIT ) UNDER PERSISTENT PRESSURE — WHAT THE CHART IS SHOWING 📉🔥
$DEBIT | DEBIT/USDT
💰 Price: 2.07111
📉 24H Change: -4.19%
📊 24H High: 2.16239
📉 24H Low: 2.03075
💵 24H Volume: $78.92M
⚠️ Market Breakdown (4H Timeframe):
Debit is continuing its downward drift following a major breakdown from the 2.59621 high zone 🧨
🔻 Price dropped steadily beneath short-term moving average resistance, forming a sequence of lower highs and lower lows
🔻 Dominant red candles reflect ongoing liquidation pressure and seller control
🔻 Lower wick near 2.01961 suggests brief demand absorbing initial selling near key support 🧲
📉 Moving Averages Tell the Story:
📌 MA(7): 2.09831
📌 MA(25): 2.18562
📌 MA(99): 2.27442
❌ Price is trading below all major MAs
❌ Clear bearish alignment (MA 7 < MA 25 < MA 99)
❌ Sellers remain fully in control 🐻
📊 Volume Insight:
🔴 Heavy sell volume backed the breakdown from higher consolidation levels
💥 Confirms institutional distribution and active position unwinding
⚠️ Volume has moderated near lower levels — expecting range consolidation before the next decisive move
🧠 What This Means:
This is a clear downtrend continuation with weak buying response on rebounds ❌
🔹 Short-term trend: Bearish
🔹 Momentum: Weak
🔹 Market emotion: Caution / Defensive 😨
🎯 Key Levels to Watch:
🟢 Support: 2.01000 – 2.03000 zone
🔴 Resistance: 2.09800 – 2.18500 zone
📌 A reclaim above 2.09800 (MA7) is required to stall immediate selling pressure
📌 Breakdown below 2.01961 could trigger further downward exploration
💡 Final Take:
🧨 DEBIT remains in a fragile, high-risk bearish trend
🧘 Avoid impulse buying against an active downtrend
🛡️ Risk management remains essential
Markets test discipline — act with precision 💎
#DEBIT #CryptoAnalysis #TradingSignals #CryptoBearish #Binance
$DEBIT
$DEBIT | DEBIT/USDT
💰 Price: 2.07111
📉 24H Change: -4.19%
📊 24H High: 2.16239
📉 24H Low: 2.03075
💵 24H Volume: $78.92M
⚠️ Market Breakdown (4H Timeframe):
Debit is continuing its downward drift following a major breakdown from the 2.59621 high zone 🧨
🔻 Price dropped steadily beneath short-term moving average resistance, forming a sequence of lower highs and lower lows
🔻 Dominant red candles reflect ongoing liquidation pressure and seller control
🔻 Lower wick near 2.01961 suggests brief demand absorbing initial selling near key support 🧲
📉 Moving Averages Tell the Story:
📌 MA(7): 2.09831
📌 MA(25): 2.18562
📌 MA(99): 2.27442
❌ Price is trading below all major MAs
❌ Clear bearish alignment (MA 7 < MA 25 < MA 99)
❌ Sellers remain fully in control 🐻
📊 Volume Insight:
🔴 Heavy sell volume backed the breakdown from higher consolidation levels
💥 Confirms institutional distribution and active position unwinding
⚠️ Volume has moderated near lower levels — expecting range consolidation before the next decisive move
🧠 What This Means:
This is a clear downtrend continuation with weak buying response on rebounds ❌
🔹 Short-term trend: Bearish
🔹 Momentum: Weak
🔹 Market emotion: Caution / Defensive 😨
🎯 Key Levels to Watch:
🟢 Support: 2.01000 – 2.03000 zone
🔴 Resistance: 2.09800 – 2.18500 zone
📌 A reclaim above 2.09800 (MA7) is required to stall immediate selling pressure
📌 Breakdown below 2.01961 could trigger further downward exploration
💡 Final Take:
🧨 DEBIT remains in a fragile, high-risk bearish trend
🧘 Avoid impulse buying against an active downtrend
🛡️ Risk management remains essential
Markets test discipline — act with precision 💎
#DEBIT #CryptoAnalysis #TradingSignals #CryptoBearish #Binance
$DEBIT