
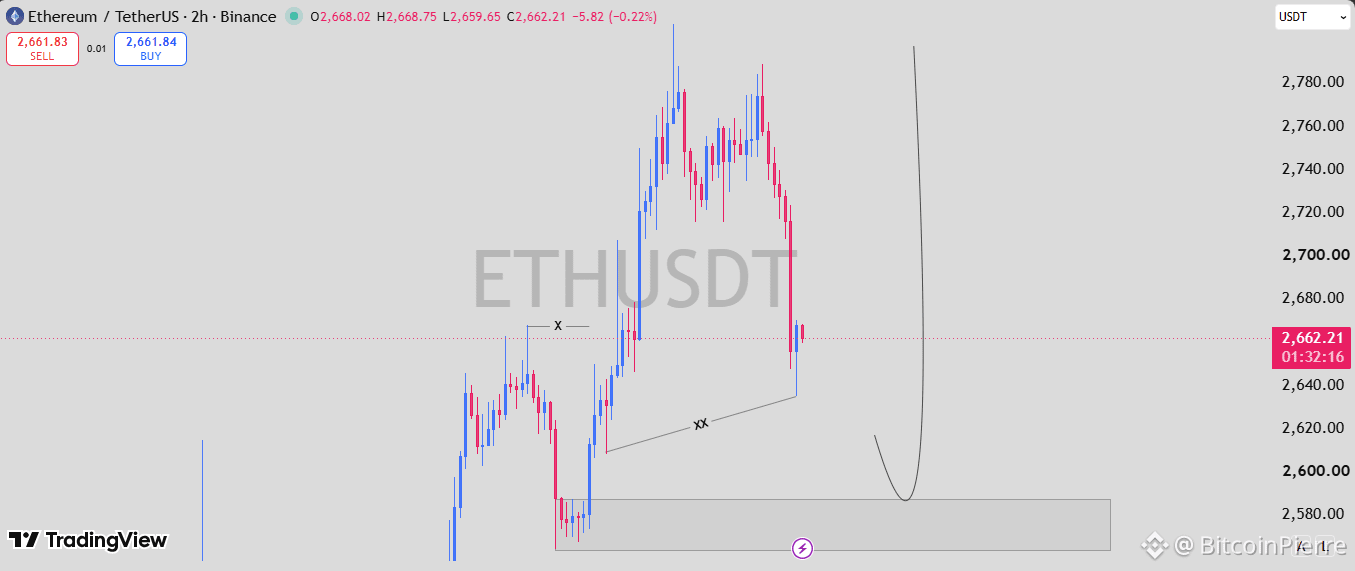
$ETH /USDT CHART Ethereum is showing a clear short term correction on the 2H chart after failing to sustain the $2,760–$2,780 region. Price has fallen back toward $2,660, but the structure still leaves room for a deeper retracement before the next major directional move. The key area on this chart is the marked $2,570–$2,590 demand zone. This region supported the previous consolidation before ETH accelerated toward the $2,700+ area, making it an important test if the current sell-off continues. If ETH reaches this zone and buyers respond with a strong reaction, the chart setup points toward a potential recovery back through $2,700, with the previous $2,760–$2,780 highs becoming the major resistance. A successful breakout above that region would open the possibility of further continuation. However, losing $2,570 decisively would weaken the setup and suggest the correction is developing into something deeper. Recent market data also shows ETH experiencing elevated volatility after reaching above $2,800 earlier in the week #BTC Price Analysis# #Macro Insights# $BTC


Veröffentlichen
Haftungsausschluss: Enthält Meinungen von Drittanbietern. Keine Beratung. Binance AI wird ohne Gewähr bereitgestellt. Siehe AGB.