
BITCOIN’S CURRENT BEAR CYCLE IS BREAKING THE OLD FOUR-YEAR PLAYBOOK
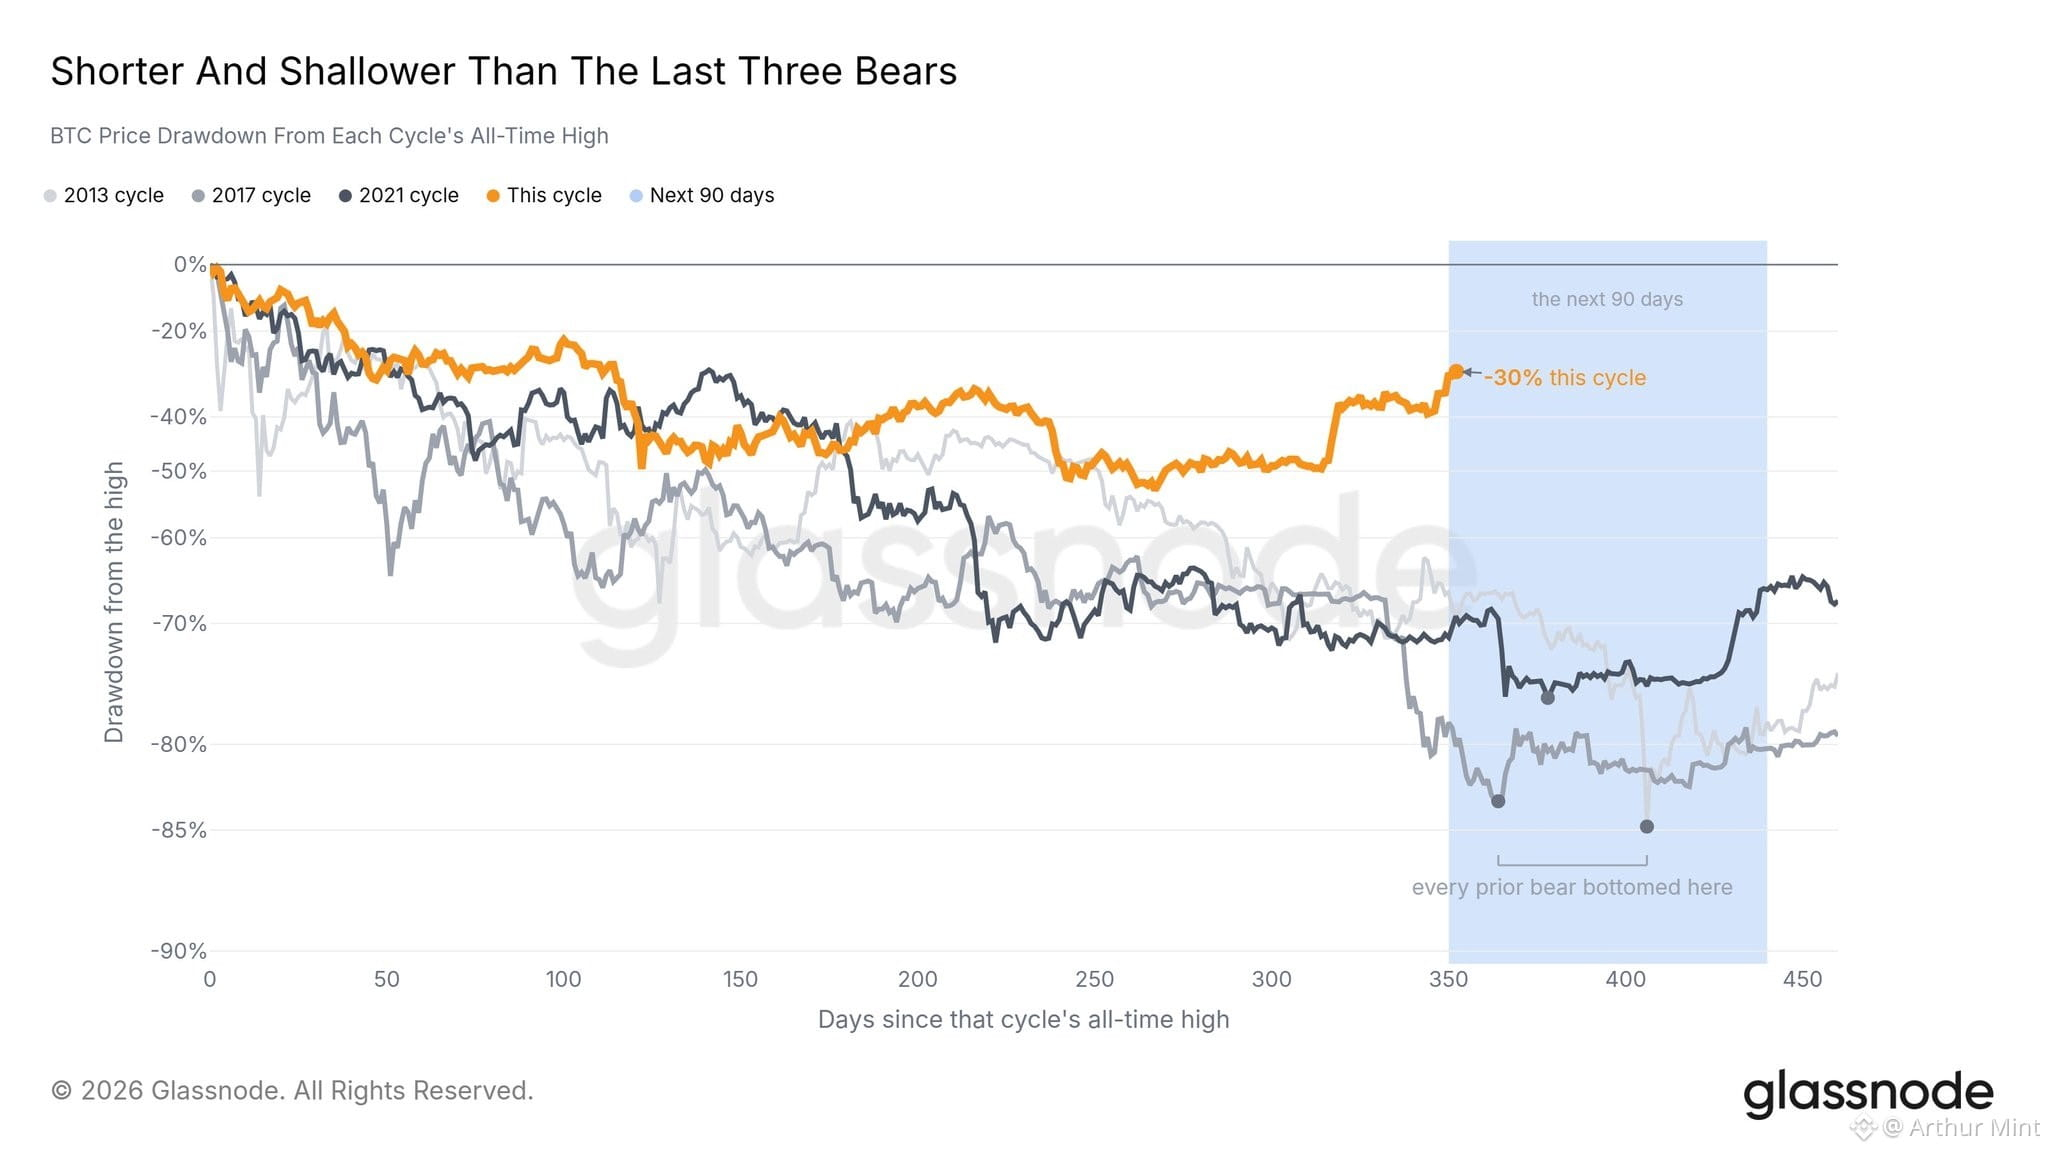
Bitcoin’s current drawdown looks notably different from the previous three cycles shown in the chart. The earlier bears eventually reached declines of more than 70%, while the current cycle is around 30% below its all-time high.
Just as important, the prior cycles took much longer to reach their deepest levels. The chart shows their major bottoms developing well beyond the current point in the cycle.
Meanwhile, Bitcoin’s drawdown has recovered from roughly 50% to around 30%, suggesting resilience rather than continued deterioration.
For crypto markets, that matters because a shallower, faster-recovering cycle could challenge expectations built around historical bear-market behavior. The next 90 days remain the key window highlighted by the chart.
Still, another sharp decline cannot be ruled out. Is $BTC rewriting the cycle script?
Bitcoin’s current drawdown looks notably different from the previous three cycles shown in the chart. The earlier bears eventually reached declines of more than 70%, while the current cycle is around 30% below its all-time high.
Just as important, the prior cycles took much longer to reach their deepest levels. The chart shows their major bottoms developing well beyond the current point in the cycle.
Meanwhile, Bitcoin’s drawdown has recovered from roughly 50% to around 30%, suggesting resilience rather than continued deterioration.
For crypto markets, that matters because a shallower, faster-recovering cycle could challenge expectations built around historical bear-market behavior. The next 90 days remain the key window highlighted by the chart.
Still, another sharp decline cannot be ruled out. Is $BTC rewriting the cycle script?