
$OURA
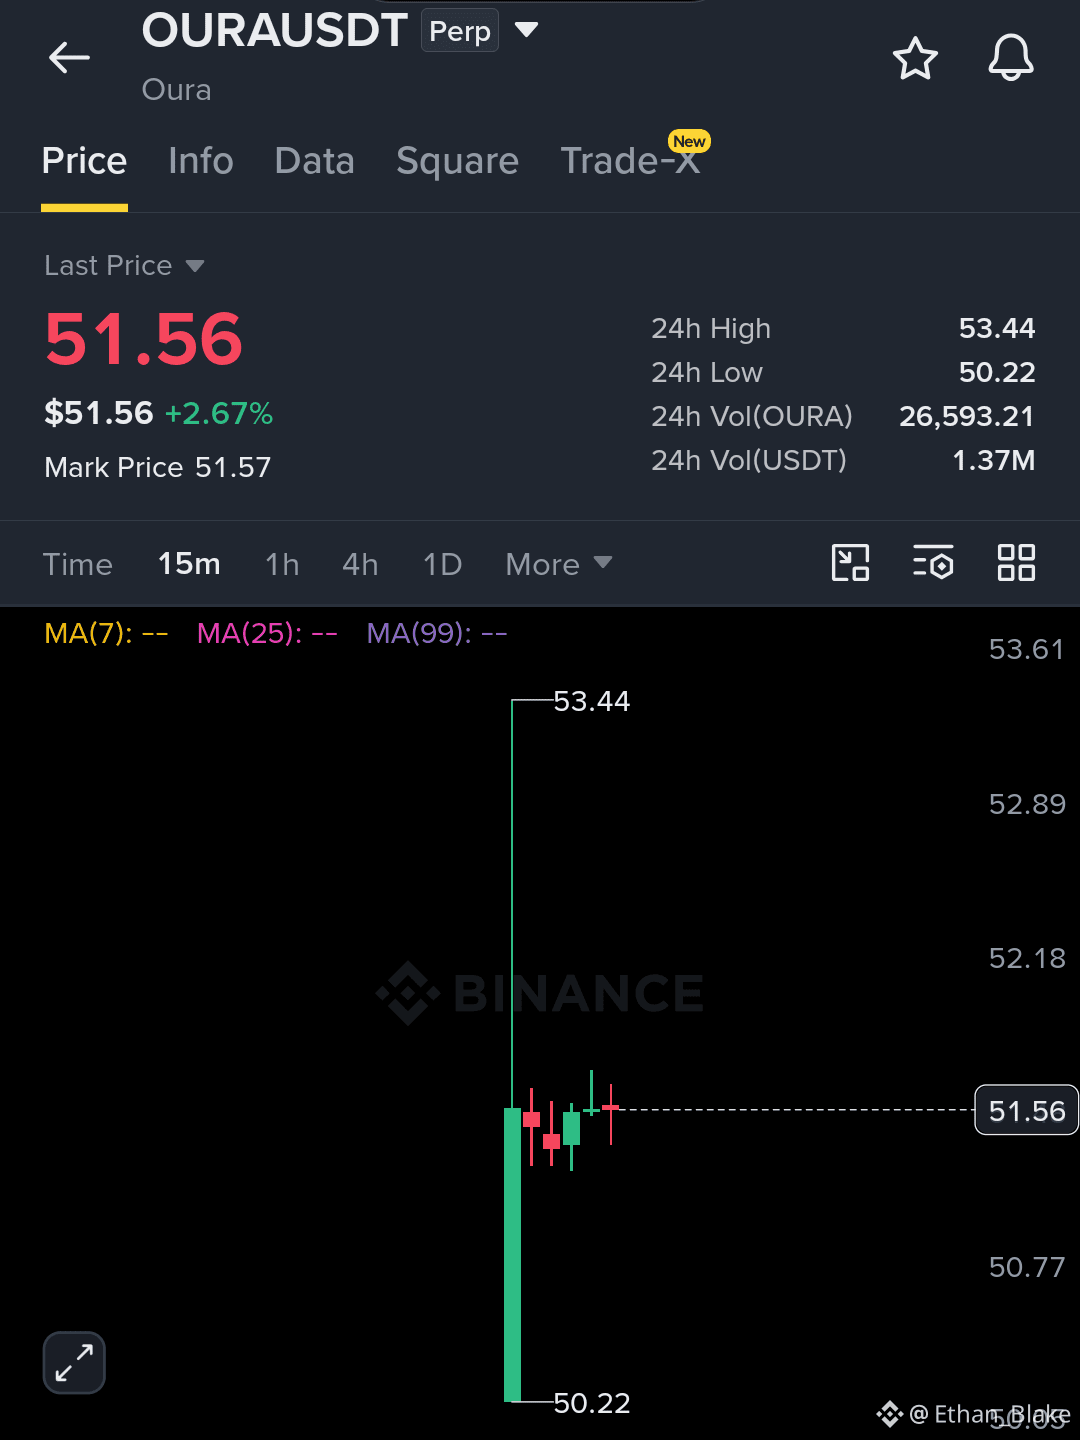
I’m seeing a strong move on the 15m chart, with OURA trading around $51.56 and up 2.67% over 24 hours.
The chart shows a sharp push from the $50.22 low to $53.44 high, followed by a small sideways pause near $51.50. That means volatility is high, so the next breakout or rejection matters.
Current Price: $51.56
24H Change: +2.67%
24H High: $53.44
24H Low: $50.22
Buy Zone: $51.00–$51.60 as a chart area to watch, not a guaranteed entry.
Target Areas:
TP1: $52.18
TP2: $52.89
TP3: $53.44
Risk Level: $50.22 is the key recent low. A move below it would weaken the current short-term structure.
Support: $50.22–$50.77
Resistance: $52.18–$53.44
Market Feeling: Bullish but very volatile. Price is holding above the recent low, but the $53.44 high is still the major resistance visible on this chart.
I’m watching the $52.18 area closely. A clean move above resistance would change the chart picture, while rejection could send price back toward the lower support zone.
This is chart analysis, not a guaranteed trade signal. Binance has also identified OURAUSDT as a pre-IPO perpetual contract, so volatility and risk can be significant.
Follow for more
Share with your trading fam.
$OURA
I’m seeing a strong move on the 15m chart, with OURA trading around $51.56 and up 2.67% over 24 hours.
The chart shows a sharp push from the $50.22 low to $53.44 high, followed by a small sideways pause near $51.50. That means volatility is high, so the next breakout or rejection matters.
Current Price: $51.56
24H Change: +2.67%
24H High: $53.44
24H Low: $50.22
Buy Zone: $51.00–$51.60 as a chart area to watch, not a guaranteed entry.
Target Areas:
TP1: $52.18
TP2: $52.89
TP3: $53.44
Risk Level: $50.22 is the key recent low. A move below it would weaken the current short-term structure.
Support: $50.22–$50.77
Resistance: $52.18–$53.44
Market Feeling: Bullish but very volatile. Price is holding above the recent low, but the $53.44 high is still the major resistance visible on this chart.
I’m watching the $52.18 area closely. A clean move above resistance would change the chart picture, while rejection could send price back toward the lower support zone.
This is chart analysis, not a guaranteed trade signal. Binance has also identified OURAUSDT as a pre-IPO perpetual contract, so volatility and risk can be significant.
Follow for more
Share with your trading fam.
$OURA