BTC Technical Analysis
$BTC
🚨 I can’t reliably predict whether BTC will rise or fall next. The current technical picture is mixed: the higher-timeframe trend remains strong, but short-term momentum has cooled and the market looks stretched.
Current market structure
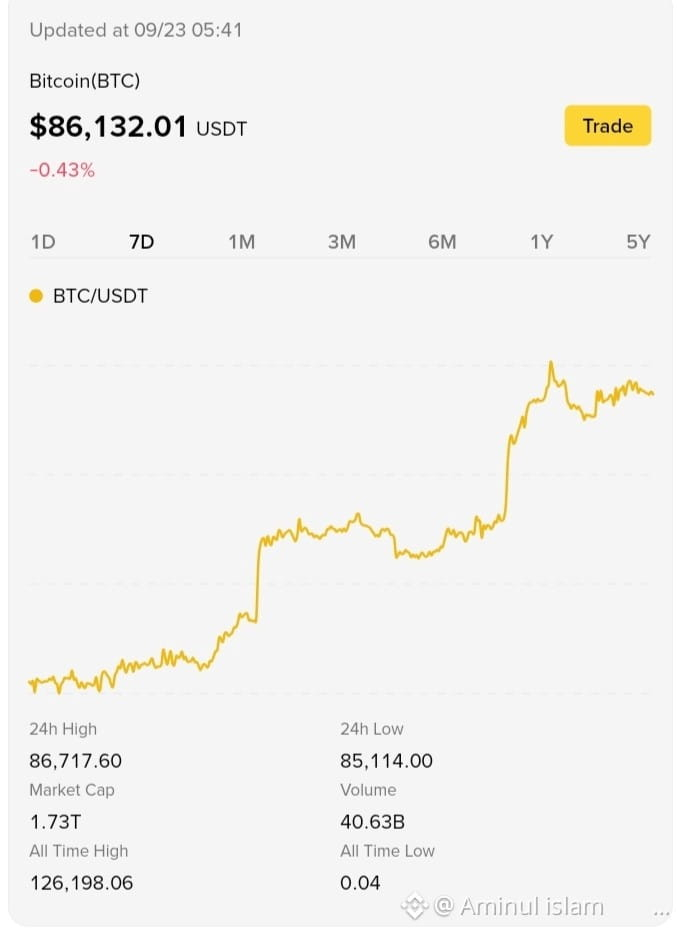
BTC Spot price: $86,121.44
24-hour change: -0.34%
7-day change: +12.52%
30-day change: +11.62%
90-day change: +42.94%
The strong 7-day and 30-day gains show that buyers have recently controlled the broader trend. However, the small negative 24-hour move suggests short-term consolidation or profit-taking is present.
1-hour technical view
RSI: 54.37 — neutral zone; neither strongly overbought nor oversold.
EMA 7: $86,234.70
EMA 25: $85,897.86
SAR: $85,728.53
SuperTrend: $84,843.03
Bollinger Band range: $85,285.86–$86,803.84
MACD DIF: -102.91, with no confirmed cross shown.
On the 1-hour chart, BTC is slightly below its short EMA but remains above the EMA 25, SAR, and SuperTrend. This indicates short-term momentum is uncertain rather than decisively bearish.
Daily technical view
Daily RSI: 75.48 — elevated/overbought territory.
EMA 7: $81,142.29
EMA 25: $78,105.33
EMA 99: $72,234.21
Daily MACD: bullish cross
Daily SuperTrend: $76,252.54
Daily SAR: $75,633.99
Daily Bollinger upper band: $83,951.64
The daily chart remains structurally bullish: price is above the major moving averages, SuperTrend, and SAR, while MACD has a bullish cross. The main caution is the high daily RSI and price being above the daily upper Bollinger Band, which indicates the rally is extended and volatility or pullback risk is elevated.
Important chart zones
Near-term resistance: approximately $86,800–$87,400, based on the 1-hour upper Bollinger Band and recent 4-hour highs.
Near-term support: approximately $85,300–$85,700, based on the 1-hour lower Bollinger Band, SAR, and recent 4-hour trading range.
Deeper trend support: around $84,843 on the 1-hour SuperTrend.
Broader daily support: around $81,142, near the daily EMA 7.#AIStocksWhatNext #BTC
$BTC
$BTC
🚨 I can’t reliably predict whether BTC will rise or fall next. The current technical picture is mixed: the higher-timeframe trend remains strong, but short-term momentum has cooled and the market looks stretched.
Current market structure
BTC Spot price: $86,121.44
24-hour change: -0.34%
7-day change: +12.52%
30-day change: +11.62%
90-day change: +42.94%
The strong 7-day and 30-day gains show that buyers have recently controlled the broader trend. However, the small negative 24-hour move suggests short-term consolidation or profit-taking is present.
1-hour technical view
RSI: 54.37 — neutral zone; neither strongly overbought nor oversold.
EMA 7: $86,234.70
EMA 25: $85,897.86
SAR: $85,728.53
SuperTrend: $84,843.03
Bollinger Band range: $85,285.86–$86,803.84
MACD DIF: -102.91, with no confirmed cross shown.
On the 1-hour chart, BTC is slightly below its short EMA but remains above the EMA 25, SAR, and SuperTrend. This indicates short-term momentum is uncertain rather than decisively bearish.
Daily technical view
Daily RSI: 75.48 — elevated/overbought territory.
EMA 7: $81,142.29
EMA 25: $78,105.33
EMA 99: $72,234.21
Daily MACD: bullish cross
Daily SuperTrend: $76,252.54
Daily SAR: $75,633.99
Daily Bollinger upper band: $83,951.64
The daily chart remains structurally bullish: price is above the major moving averages, SuperTrend, and SAR, while MACD has a bullish cross. The main caution is the high daily RSI and price being above the daily upper Bollinger Band, which indicates the rally is extended and volatility or pullback risk is elevated.
Important chart zones
Near-term resistance: approximately $86,800–$87,400, based on the 1-hour upper Bollinger Band and recent 4-hour highs.
Near-term support: approximately $85,300–$85,700, based on the 1-hour lower Bollinger Band, SAR, and recent 4-hour trading range.
Deeper trend support: around $84,843 on the 1-hour SuperTrend.
Broader daily support: around $81,142, near the daily EMA 7.#AIStocksWhatNext #BTC
$BTC