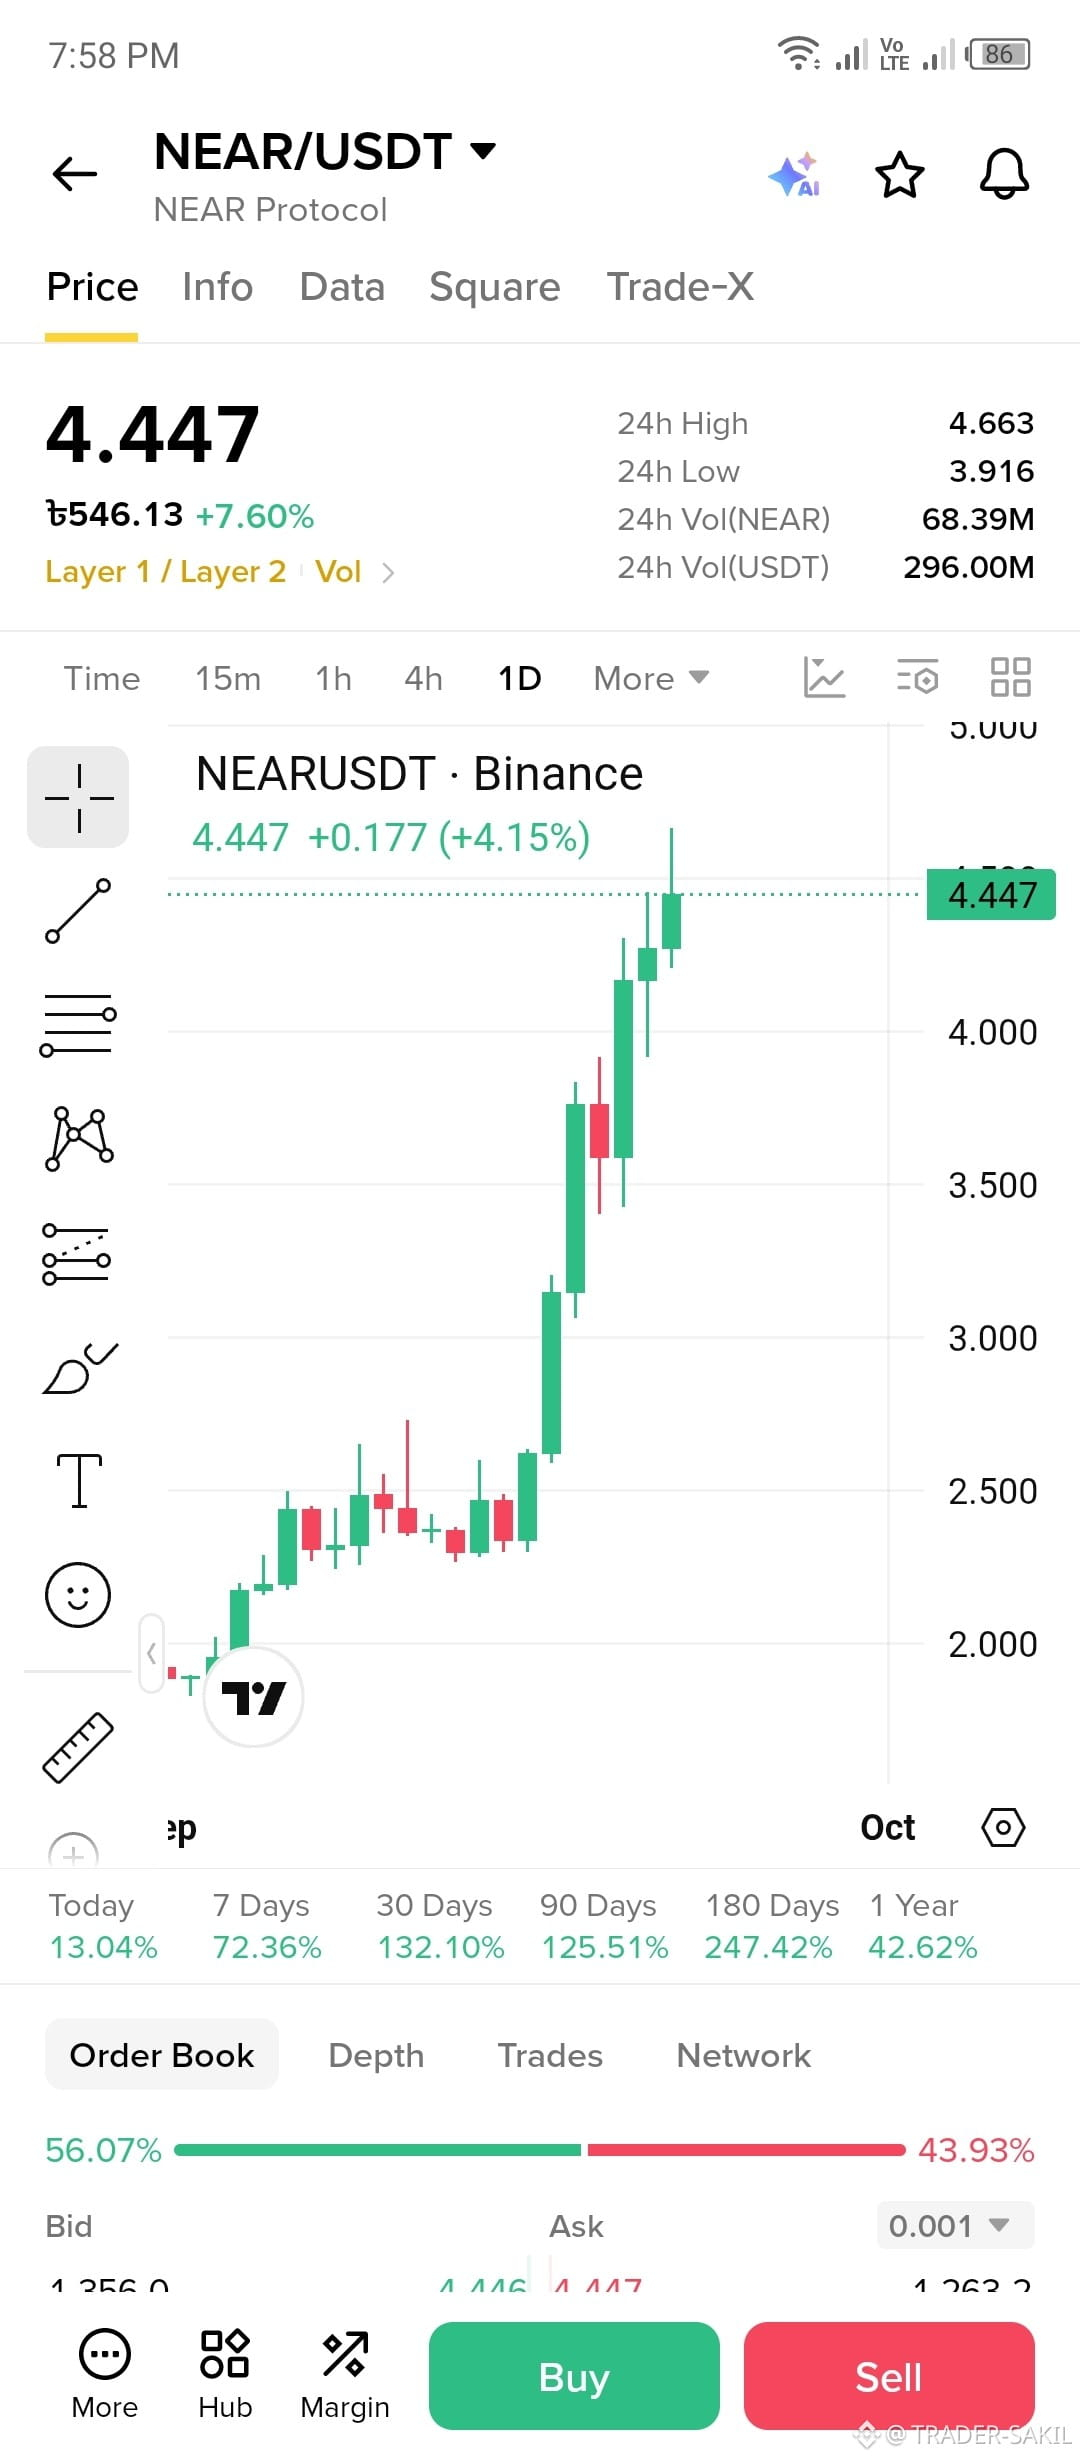
$NEAR /USDT Chart Analysis ⚡🔥
Current price: $4.447
24H high: $4.663
24H low: $3.916
24H change: +7.60%
Trend: The 1D chart shows strong bullish momentum. NEAR has moved sharply upward from the $2.0–$2.5 area and is now trading above $4.40, with several strong green daily candles.
Key levels:
Resistance: $4.66–$4.70
Psychological level: $5.00
Support: $4.00–$4.10
Lower support: $3.50–$3.60
Momentum: The screenshot shows +72.36% over 7 days and +132.10% over 30 days, indicating a very strong recent move.
Caution: After such a rapid rally, a pullback or consolidation is possible. The order-book ratio (56.07% bids vs. 43.93% asks) is only a snapshot and should not be treated as a guaranteed direction signal.
Bottom line: NEAR is currently showing strong bullish structure, but $4.66–$4.70 is the key area to watch, while $4.00–$4.10 is an important nearby support zone.
Current price: $4.447
24H high: $4.663
24H low: $3.916
24H change: +7.60%
Trend: The 1D chart shows strong bullish momentum. NEAR has moved sharply upward from the $2.0–$2.5 area and is now trading above $4.40, with several strong green daily candles.
Key levels:
Resistance: $4.66–$4.70
Psychological level: $5.00
Support: $4.00–$4.10
Lower support: $3.50–$3.60
Momentum: The screenshot shows +72.36% over 7 days and +132.10% over 30 days, indicating a very strong recent move.
Caution: After such a rapid rally, a pullback or consolidation is possible. The order-book ratio (56.07% bids vs. 43.93% asks) is only a snapshot and should not be treated as a guaranteed direction signal.
Bottom line: NEAR is currently showing strong bullish structure, but $4.66–$4.70 is the key area to watch, while $4.00–$4.10 is an important nearby support zone.