$SOL
Here is the latest short market analysis and color candlestick chart for Solana (SOL) as of September 2026.
## Market Overview & Price Action
* Current Price: Trading around $117.00 – $117.50 USD.
* Market Capitalization: Approximately $68.7B – $69.0B USD, maintaining its strong position as a leading Layer-1 ecosystem asset (Rank #7).
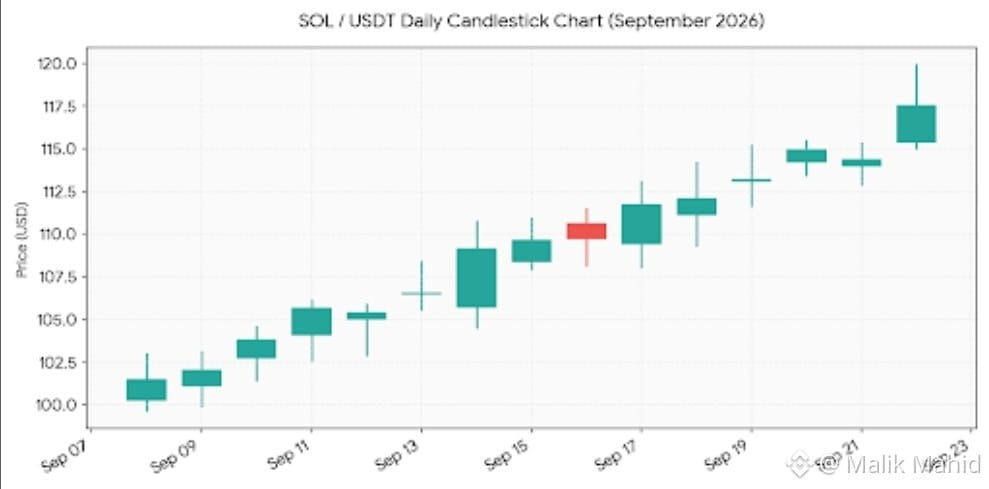
* Recent Momentum: Solana has mounted a consistent multi-week recovery rally, climbing roughly 20% over the trailing month from early September bases near $100 up toward immediate resistance zones.
## Key Catalysts & Drivers
* Network Activity & Protocol Growth: Continued high throughput and robust activity across decentralized applications (dApps) and decentralized exchange volume reinforce underlying utility demand.
* Validator Performance & Upgrades: Positive market sentiment surrounding scaling infrastructure updates (including the Firedancer validator roadmap) keeps developer and institutional interest steady.
* Macro Resilience: Sustained buyer accumulation even amidst broader macroeconomic policy adjustments (such as recent interest rate decisions) highlights strong underlying support.
## Technical Structure & Key Levels
* Immediate Support Zone: $110.00 – $112.00 USD (former consolidation ceiling acting as near-term support).
* Immediate Resistance Zone: $119.00 – $120.00 USD (the psychological hurdle currently testing buyer strength).
* Bullish Target: A confirmed daily candle close above $120.00 clears the path for an extension toward $123.00 and $132.00.
## SOL/USDT Daily Candlestick Chart
(Note: The chart illustrates the steady stair-step recovery from the $100 support level through mid-September into the current test of the $119–$120 resistance zone.)
Are you tracking Solana for spot accumulation, or are you waiting for a definitive breakout confirmation above the $120 mark?
#AIStocksWhatNext
#MuseOvertakesChatGPTAsTopFreeIOSApp
#TokenizedStockPlatformsCouldLaunchNextQuarter
Here is the latest short market analysis and color candlestick chart for Solana (SOL) as of September 2026.
## Market Overview & Price Action
* Current Price: Trading around $117.00 – $117.50 USD.
* Market Capitalization: Approximately $68.7B – $69.0B USD, maintaining its strong position as a leading Layer-1 ecosystem asset (Rank #7).
* Recent Momentum: Solana has mounted a consistent multi-week recovery rally, climbing roughly 20% over the trailing month from early September bases near $100 up toward immediate resistance zones.
## Key Catalysts & Drivers
* Network Activity & Protocol Growth: Continued high throughput and robust activity across decentralized applications (dApps) and decentralized exchange volume reinforce underlying utility demand.
* Validator Performance & Upgrades: Positive market sentiment surrounding scaling infrastructure updates (including the Firedancer validator roadmap) keeps developer and institutional interest steady.
* Macro Resilience: Sustained buyer accumulation even amidst broader macroeconomic policy adjustments (such as recent interest rate decisions) highlights strong underlying support.
## Technical Structure & Key Levels
* Immediate Support Zone: $110.00 – $112.00 USD (former consolidation ceiling acting as near-term support).
* Immediate Resistance Zone: $119.00 – $120.00 USD (the psychological hurdle currently testing buyer strength).
* Bullish Target: A confirmed daily candle close above $120.00 clears the path for an extension toward $123.00 and $132.00.
## SOL/USDT Daily Candlestick Chart
(Note: The chart illustrates the steady stair-step recovery from the $100 support level through mid-September into the current test of the $119–$120 resistance zone.)
Are you tracking Solana for spot accumulation, or are you waiting for a definitive breakout confirmation above the $120 mark?
#AIStocksWhatNext
#MuseOvertakesChatGPTAsTopFreeIOSApp
#TokenizedStockPlatformsCouldLaunchNextQuarter