
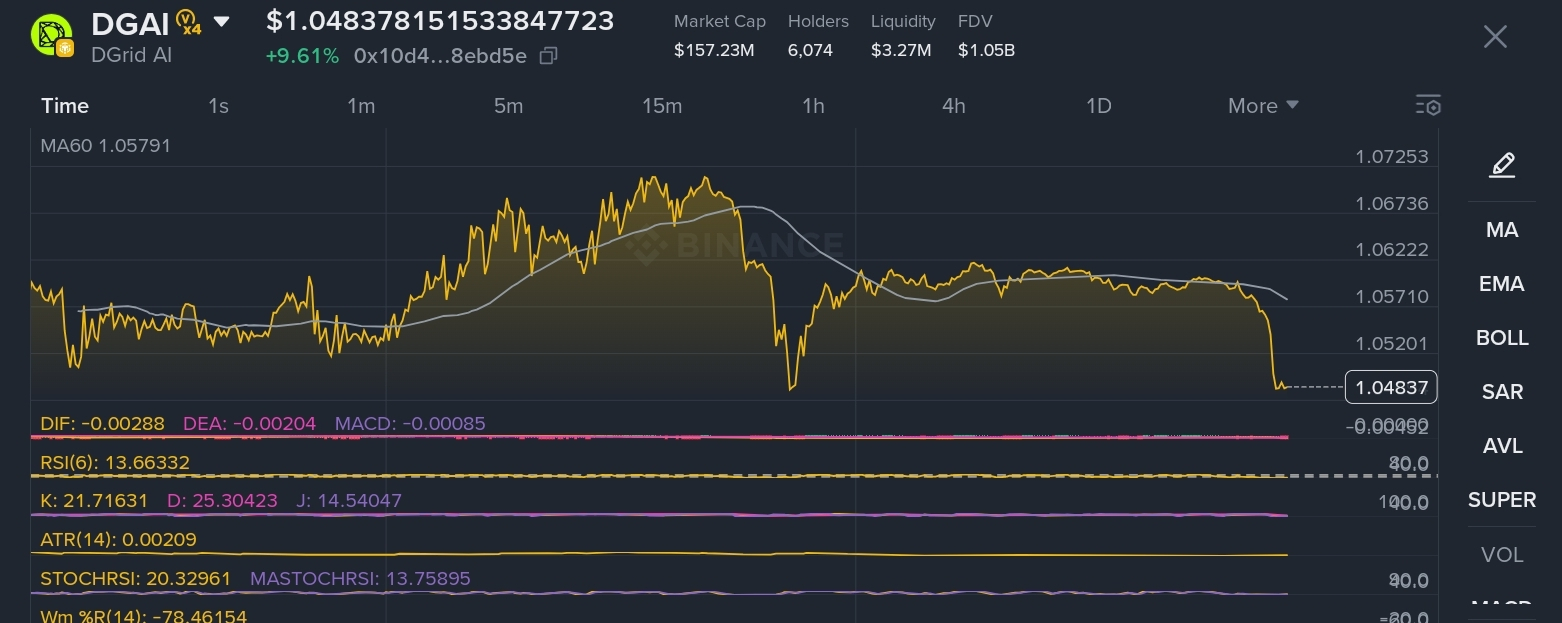

DGrid AI is commanding serious attention across the cryptocurrency market, securing over $1 billion in trading volume within a 24-hour window. Operating as a decentralized smart network that provides a unified gateway to over 200 artificial intelligence models, the fundamental utility of the DGAI token spans payments, staking, incentives, and governance. Despite this robust utility and a sharp 10.54% price increase pushing the asset into the $1.04 to $1.05 range, a deeper structural analysis reveals severe volatility risks driven by liquidity fragmentation and supply concentration.
Liquidity Turnover and Mathematical Dilution Analysis
The financial architecture of DGAI presents extreme mathematical divergences between on-chain liquidity and trading velocity. The token has a circulating supply of 150 million against a maximum total supply of 1 billion. At a current price of roughly $1.048, the circulating market capitalization stands at $157.15 million, while the Fully Diluted Valuation (FDV) reaches $1.05 billion.
We can mathematically quantify the structural market pressure through a Volume-to-Liquidity Turnover calculation. The 24-hour trading volume is $1.07 billion. Total on-chain DEX liquidity is recorded at a mere $3.27 million. By dividing the $1.07 billion volume by the $3.27 million on-chain liquidity, we find a Liquidity Turnover Ratio of approximately 327.2x per day. This means the total available decentralized liquidity pool is turned over more than 300 times every 24 hours. A ratio of this magnitude strongly implies heavy high-frequency algorithmic arbitrage between centralized exchanges and decentralized platforms, rather than organic retail accumulation.
Furthermore, the Supply Dilution Overhang calculation highlights a significant long-term headwind. Subtracting the 150 million circulating tokens from the 1 billion total supply leaves 850 million locked or uncirculated tokens. Multiplying these 850 million uncirculated tokens by the current $1.048 price yields an inflationary overhang of $890.8 million. As these tokens vest and enter circulation, the current liquidity depth of just 2.08% (calculated as $3.27 million liquidity divided by the $157.15 million market cap) will not be sufficient to absorb new selling pressure without massive slippage.
The 98.21% Concentration Risk
The most critical threat to current DGAI holders is token distribution. Analytical insights reveal that the top 10 holding addresses control 98.21% of the total token supply.
This concentration fundamentally alters the market mechanics for the 6,072 individual chain holders. Subtracting the 98.21% whale dominance from the total supply leaves only 1.79% as the true retail float. In absolute terms, this represents just 17.9 million tokens distributed among the public. If any of the top 10 entities decide to liquidate even a fraction of their holdings, the resulting sell orders would instantaneously overwhelm the $3.27 million in available on-chain liquidity, triggering a severe downside cascade.
Adding to this pressure, Smart Money addresses are actively realizing profits. On-chain intelligence indicates these entities have secured $468.06 in localized profit, executing sells at an average price of $0.9266 after accumulating at an average buy price of $0.9126. This strategic exit behavior by sophisticated capital often serves as a leading indicator of exhaustion in short-term bullish momentum.
Technical Oscillators and Price Action
From a technical perspective on the 15-minute timeframe, DGAI is exhibiting signs of extreme localized stress. Following a rejection near the 24-hour high of $1.13519, the price compressed down toward $1.047.
The Bollinger Bands (20, 2) confirm this bearish displacement. The asset traded below the middle band baseline of $1.06102 and actively tested the lower band boundary near $1.04986. During this sharp intraday sell-off, the 15-minute 6-period Relative Strength Index (RSI) plunged to an exceptionally oversold reading of 1.80872. While an RSI this low typically signals an imminent mean-reversion bounce, the underlying momentum remains weak. The 5-minute MACD histogram shows a continuous decreasing trend, falling from positive territory to near zero, validating the fading buying pressure.
DGrid AI boasts excellent foundational technology and has successfully captured immense speculative volume. However, traders must navigate this asset with strict risk management. The mathematical reality of a 327x liquidity turnover ratio, combined with a 98.21% supply concentration among the top 10 wallets, creates an environment where abrupt, could lead to sharp volatility.