📉 #ZECUSDT 1 hourSHORT TRADE | VJ ANALYSIS
⚠️ Short setup based on the chart structure shown in the analysis image.
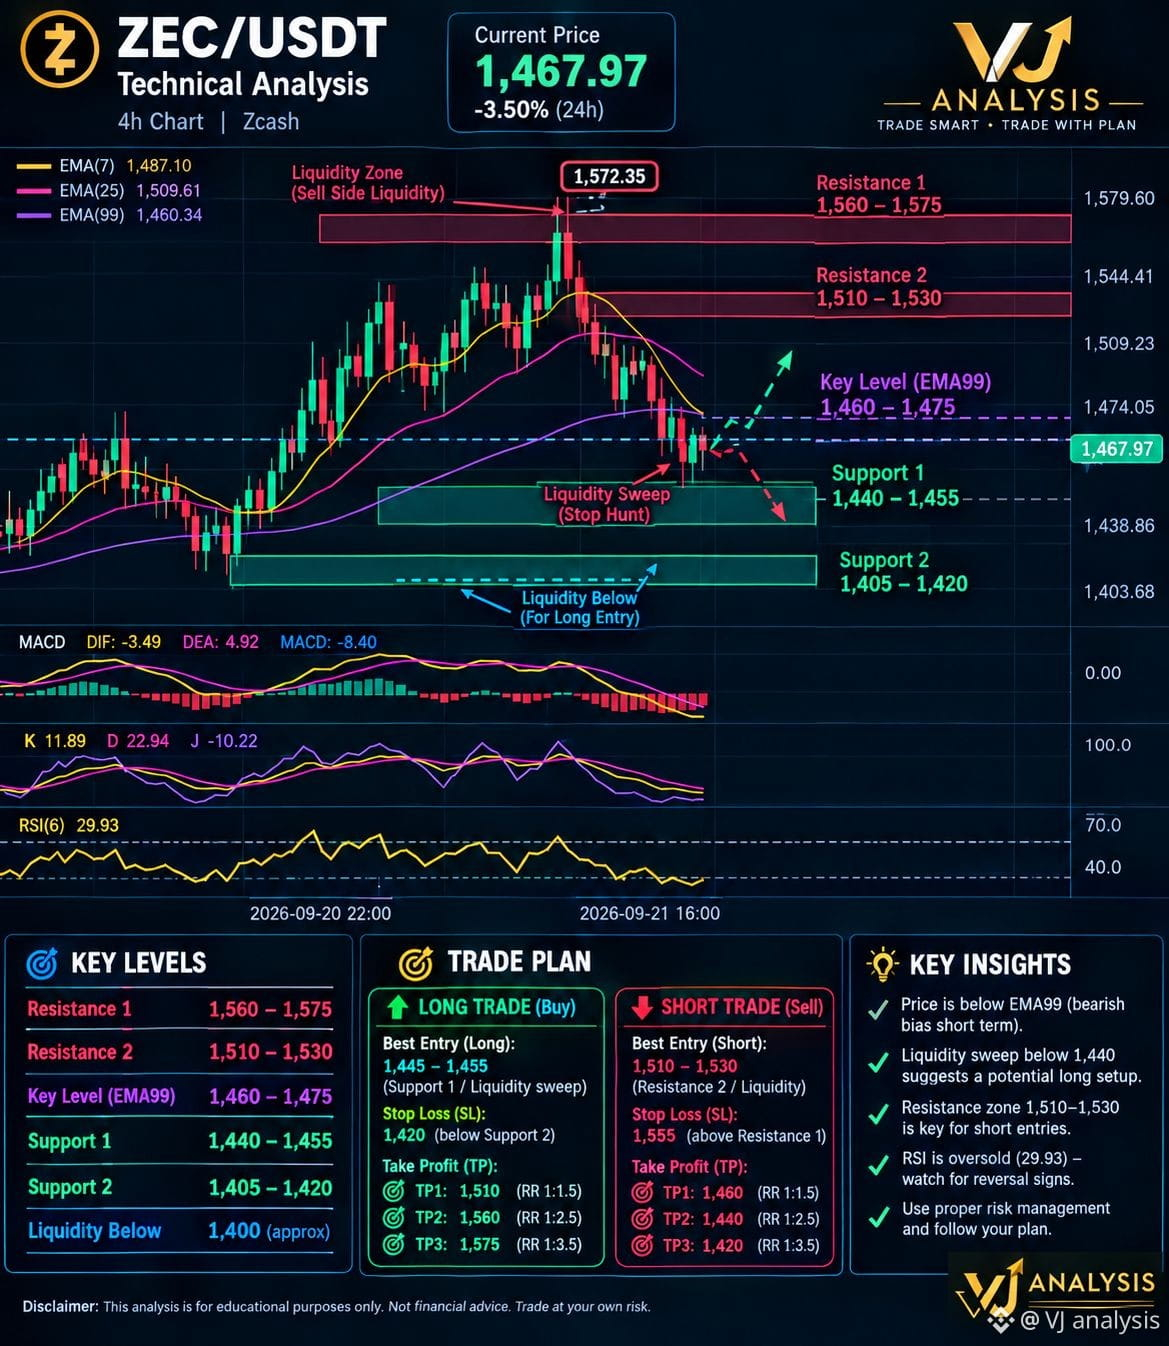
#ZECUSDT is currently trading around 1,467.97 after a strong rejection from the 1,572.35 high. On the 1H structure, price remains below the key moving averages, while momentum indicators are showing weakness. The main area to watch for a potential short entry is the 1,510–1,530 resistance/liquidity zone.
🔴 SHORT ENTRY ZONE:
1,510 – 1,530
Rather than chasing the price at current levels, the preferred approach is to wait for a retracement into this resistance zone and look for rejection confirmation such as a bearish candle, failed breakout, or lower-timeframe reversal.
🎯 TAKE PROFITS
TP1: 1,460
TP2: 1,440
TP3: 1,420
🛑 STOP LOSS:
1,555
The stop is positioned above the resistance/liquidity area. If ZEC breaks and holds above this zone, the short thesis becomes invalid and the trade should be reassessed rather than averaged into.
📊 WHY THIS SETUP?
• Price is trading below the EMA99 around 1,460–1,475 area and remains under the short-term moving averages shown on the chart.
• The 1,510–1,530 region acted as an important resistance area and may attract sellers if price retests it.
• The previous high near 1,572 represents a major liquidity/resistance area.
• MACD momentum is bearish, with the histogram remaining negative.
• KDJ is deeply weak and RSI(6) is around 30, meaning downside momentum is present but the market is also approaching an oversold condition. Therefore, chasing shorts at the current price carries additional reversal risk.
💡 TRADE MANAGEMENT
Wait for the entry zone. If price reaches 1,510–1,530 and clearly rejects, the short setup becomes more relevant. Consider securing partial profit at TP1 and moving the stop according to your risk plan after confirmation.
🚨 Important: These levels are based on the chart shown and are not guaranteed. Crypto markets can move sharply through support/resistance and liquidity zones. Use appropriate position sizing and never risk money you cannot afford to loss
⚠️ Short setup based on the chart structure shown in the analysis image.
#ZECUSDT is currently trading around 1,467.97 after a strong rejection from the 1,572.35 high. On the 1H structure, price remains below the key moving averages, while momentum indicators are showing weakness. The main area to watch for a potential short entry is the 1,510–1,530 resistance/liquidity zone.
🔴 SHORT ENTRY ZONE:
1,510 – 1,530
Rather than chasing the price at current levels, the preferred approach is to wait for a retracement into this resistance zone and look for rejection confirmation such as a bearish candle, failed breakout, or lower-timeframe reversal.
🎯 TAKE PROFITS
TP1: 1,460
TP2: 1,440
TP3: 1,420
🛑 STOP LOSS:
1,555
The stop is positioned above the resistance/liquidity area. If ZEC breaks and holds above this zone, the short thesis becomes invalid and the trade should be reassessed rather than averaged into.
📊 WHY THIS SETUP?
• Price is trading below the EMA99 around 1,460–1,475 area and remains under the short-term moving averages shown on the chart.
• The 1,510–1,530 region acted as an important resistance area and may attract sellers if price retests it.
• The previous high near 1,572 represents a major liquidity/resistance area.
• MACD momentum is bearish, with the histogram remaining negative.
• KDJ is deeply weak and RSI(6) is around 30, meaning downside momentum is present but the market is also approaching an oversold condition. Therefore, chasing shorts at the current price carries additional reversal risk.
💡 TRADE MANAGEMENT
Wait for the entry zone. If price reaches 1,510–1,530 and clearly rejects, the short setup becomes more relevant. Consider securing partial profit at TP1 and moving the stop according to your risk plan after confirmation.
🚨 Important: These levels are based on the chart shown and are not guaranteed. Crypto markets can move sharply through support/resistance and liquidity zones. Use appropriate position sizing and never risk money you cannot afford to loss