🚀 $PEPE PE /USDT Breaking Out! Is the Next Resistance Within Reach?
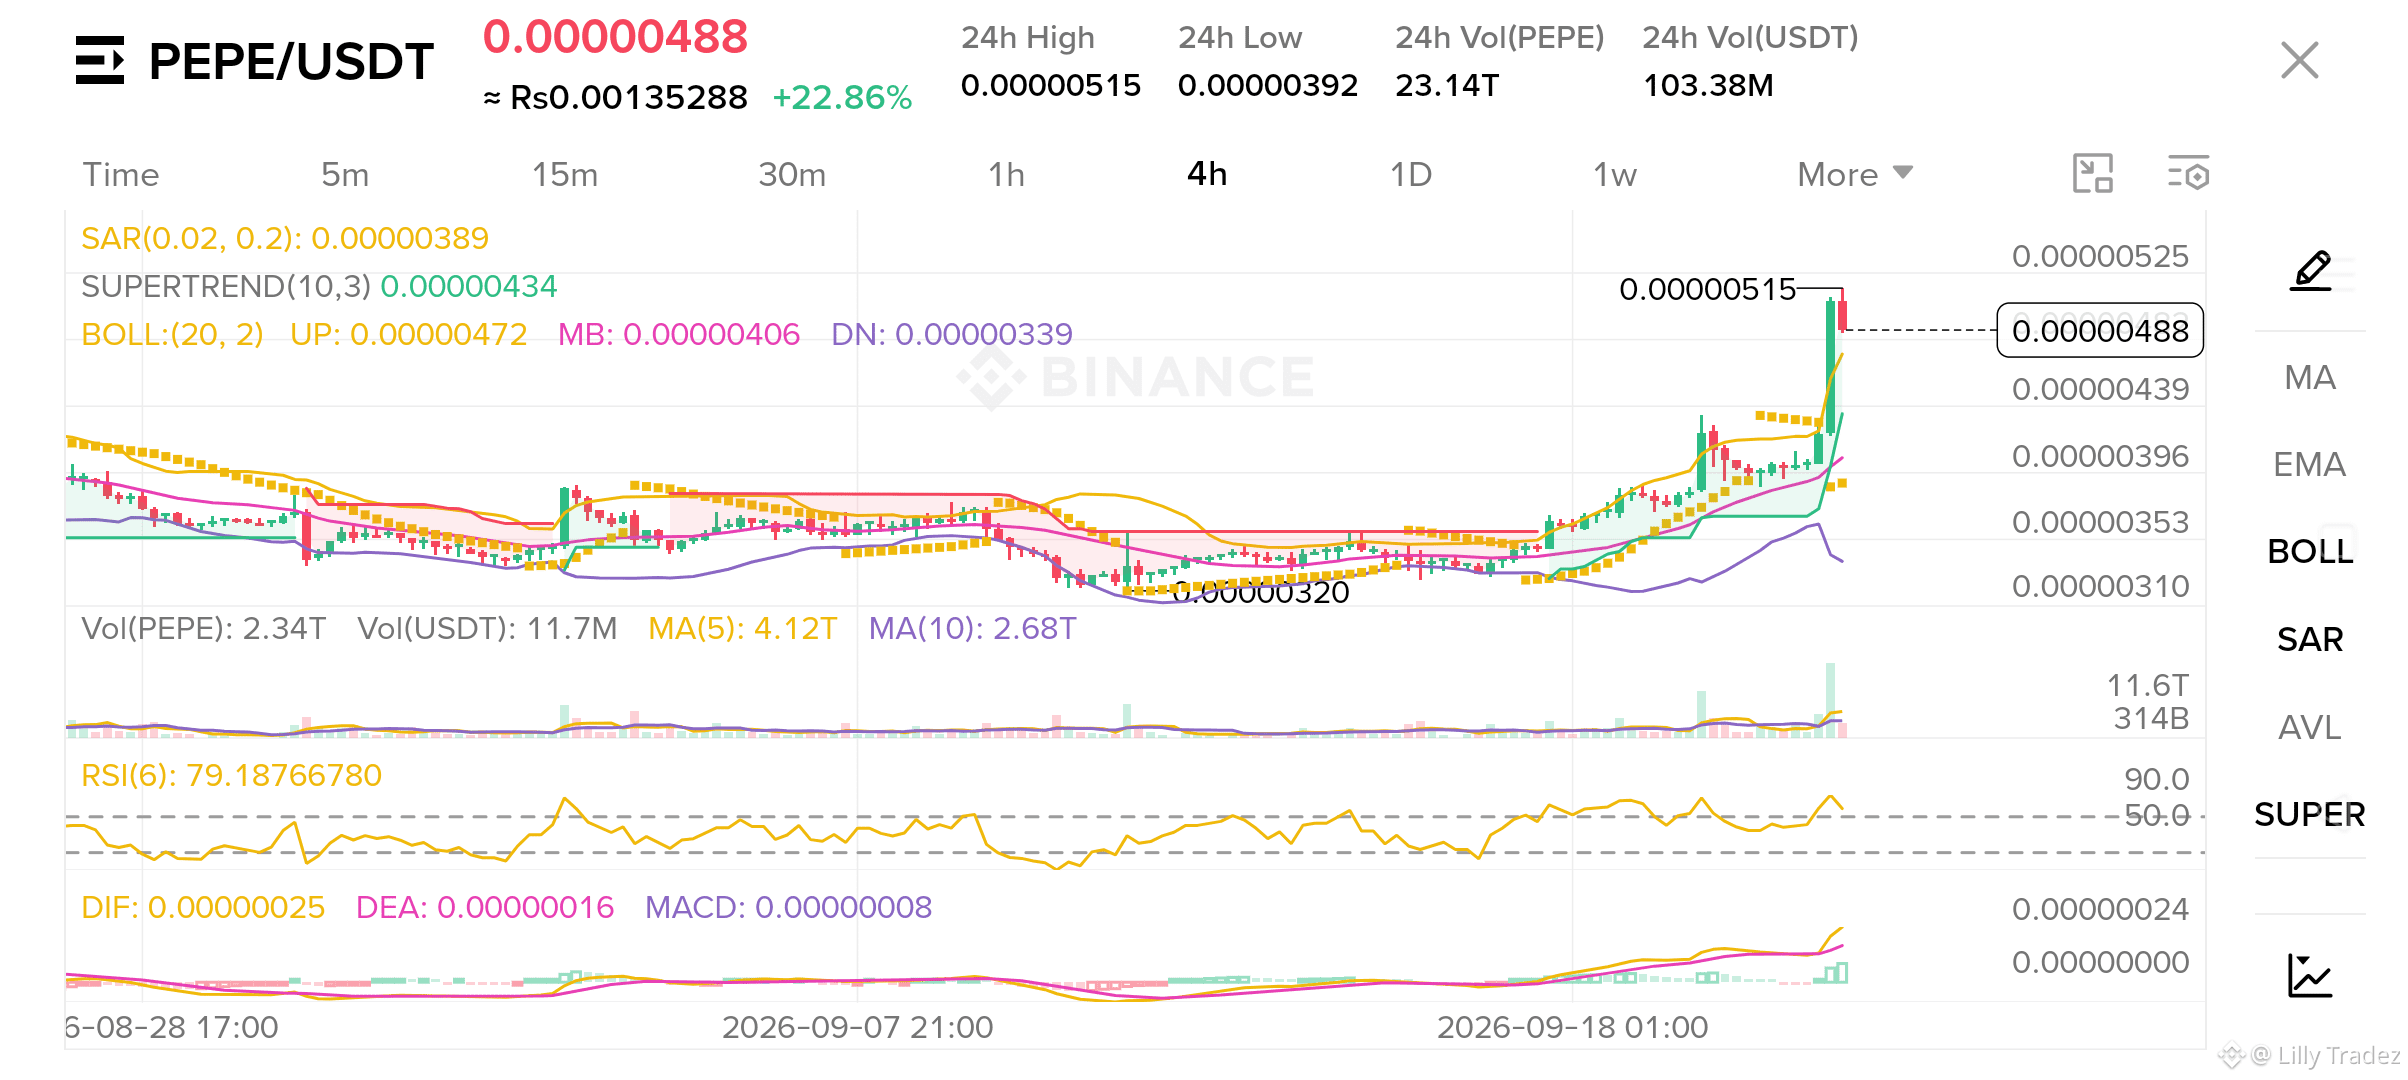
$PEPE is showing strong bullish momentum on the 4H chart, pumping +22.86% to reach 0.00000488 USDT after touching a local high of 0.00000515 USDT! 📈
Key Technical Indicators Breakdown:
Bollinger Bands: Price is riding above the Upper Band (0.00000472), showing strong upward buying pressure.
Supertrend & SAR: Both turned strong bullish, supporting the ongoing upward trend.
RSI (6): Sitting near 79.18, indicating heavily overbought conditions. A short consolidation or minor cooling-off phase could occur before the next leg up.
MACD: Bullish crossover confirmed with expanding positive histogram bars.
💡 Trader Note: Watch out for resistance near the 0.00000515 level. A clean break and close above it could trigger further gains, while key support rests around 0.00000434 (Supertrend line).
What's your plan—holding or taking profits here? Share your targets below! 👇
$PEPE is showing strong bullish momentum on the 4H chart, pumping +22.86% to reach 0.00000488 USDT after touching a local high of 0.00000515 USDT! 📈
Key Technical Indicators Breakdown:
Bollinger Bands: Price is riding above the Upper Band (0.00000472), showing strong upward buying pressure.
Supertrend & SAR: Both turned strong bullish, supporting the ongoing upward trend.
RSI (6): Sitting near 79.18, indicating heavily overbought conditions. A short consolidation or minor cooling-off phase could occur before the next leg up.
MACD: Bullish crossover confirmed with expanding positive histogram bars.
💡 Trader Note: Watch out for resistance near the 0.00000515 level. A clean break and close above it could trigger further gains, while key support rests around 0.00000434 (Supertrend line).
What's your plan—holding or taking profits here? Share your targets below! 👇