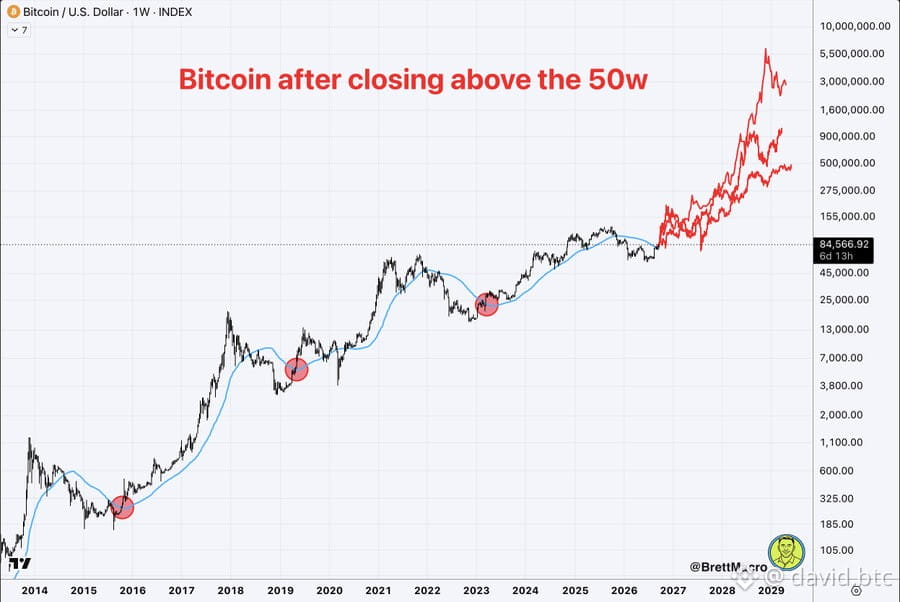
$BTC just closed the week above its 50-week MA. Last 3 times this happened? Bull market ignition.
The 50-week MA = ~1 year average price. Price above it = technical bull trend. One of the most watched levels in crypto.
Historical playbook:
Late 2015: Reclaimed at ~$260. Hit $19,700 two years later. 76x.
April 2019: Reclaimed at ~$5,000. Peaked at $69,000 in Nov 2021. 14x.
Jan 2023: Reclaimed at ~$22,000. Topped at $126,000 in Oct 2025. 6x.
Every cycle, the top came 2-3 years after the signal.
If history rhymes, we're at the START of the bull run.
Chart: BrettMacro
The 50-week MA = ~1 year average price. Price above it = technical bull trend. One of the most watched levels in crypto.
Historical playbook:
Late 2015: Reclaimed at ~$260. Hit $19,700 two years later. 76x.
April 2019: Reclaimed at ~$5,000. Peaked at $69,000 in Nov 2021. 14x.
Jan 2023: Reclaimed at ~$22,000. Topped at $126,000 in Oct 2025. 6x.
Every cycle, the top came 2-3 years after the signal.
If history rhymes, we're at the START of the bull run.
Chart: BrettMacro