📊 AAPL Market Analysis – September 21, 2026
Apple (AAPL) is currently trading around $333.82, down approximately 0.68% on the session.
🔹 Short-Term Trend:
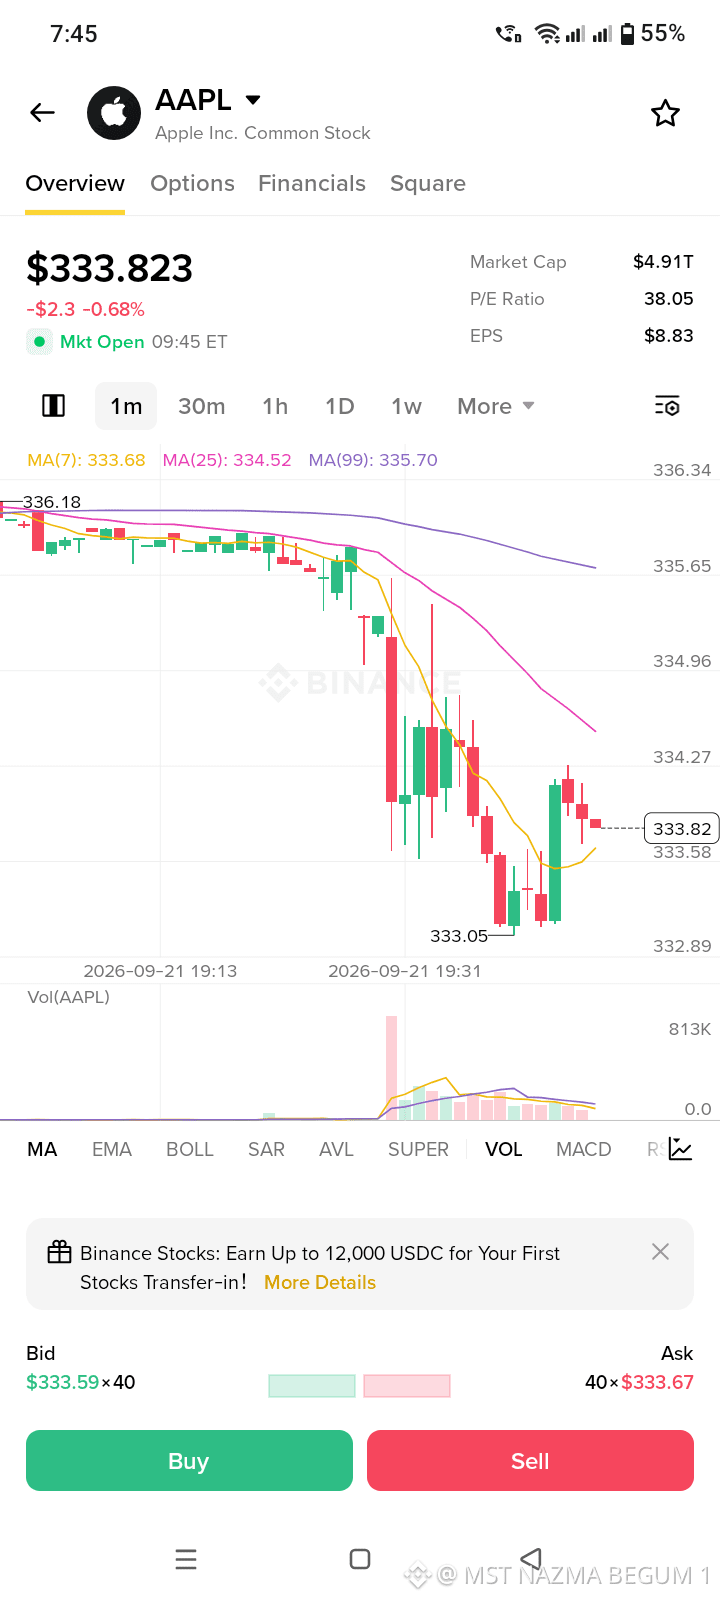
The 1-minute chart shows strong short-term selling pressure. AAPL dropped from around $336.18 toward a low near $333.05 before making a small recovery.
🔹 Moving Averages:
MA(7): $333.68
MA(25): $334.52
MA(99): $335.70
The current price is below the MA(25) and MA(99), which indicates that the short-term momentum remains bearish. The price is slightly above the MA(7), suggesting a small recovery attempt.
🔹 Support Levels:
The recent low around $333.05 is an important short-term support area. If selling pressure returns and this level breaks, the price could face further downside.
🔹 Resistance Levels:
The first resistance area is around $334.27–$334.52, followed by the $335.65–$335.70 region. A sustained move above these levels would indicate improving short-term momentum.
🔹 Volume:
There was a noticeable increase in volume during the sharp decline, confirming that the downward move attracted strong trading activity. Volume later decreased as the price attempted to recover.
📈 Overall Technical Picture:
The chart currently shows a short-term bearish structure with a minor recovery attempt. Traders may watch the $333.05 support and the $334.50–$335.70 resistance zone closely for the next directional move.
⚠️ This is a technical reading of the displayed chart, not a prediction or financial advice. Market conditions can change quickly.#AAPL
Apple (AAPL) is currently trading around $333.82, down approximately 0.68% on the session.
🔹 Short-Term Trend:
The 1-minute chart shows strong short-term selling pressure. AAPL dropped from around $336.18 toward a low near $333.05 before making a small recovery.
🔹 Moving Averages:
MA(7): $333.68
MA(25): $334.52
MA(99): $335.70
The current price is below the MA(25) and MA(99), which indicates that the short-term momentum remains bearish. The price is slightly above the MA(7), suggesting a small recovery attempt.
🔹 Support Levels:
The recent low around $333.05 is an important short-term support area. If selling pressure returns and this level breaks, the price could face further downside.
🔹 Resistance Levels:
The first resistance area is around $334.27–$334.52, followed by the $335.65–$335.70 region. A sustained move above these levels would indicate improving short-term momentum.
🔹 Volume:
There was a noticeable increase in volume during the sharp decline, confirming that the downward move attracted strong trading activity. Volume later decreased as the price attempted to recover.
📈 Overall Technical Picture:
The chart currently shows a short-term bearish structure with a minor recovery attempt. Traders may watch the $333.05 support and the $334.50–$335.70 resistance zone closely for the next directional move.
⚠️ This is a technical reading of the displayed chart, not a prediction or financial advice. Market conditions can change quickly.#AAPL