


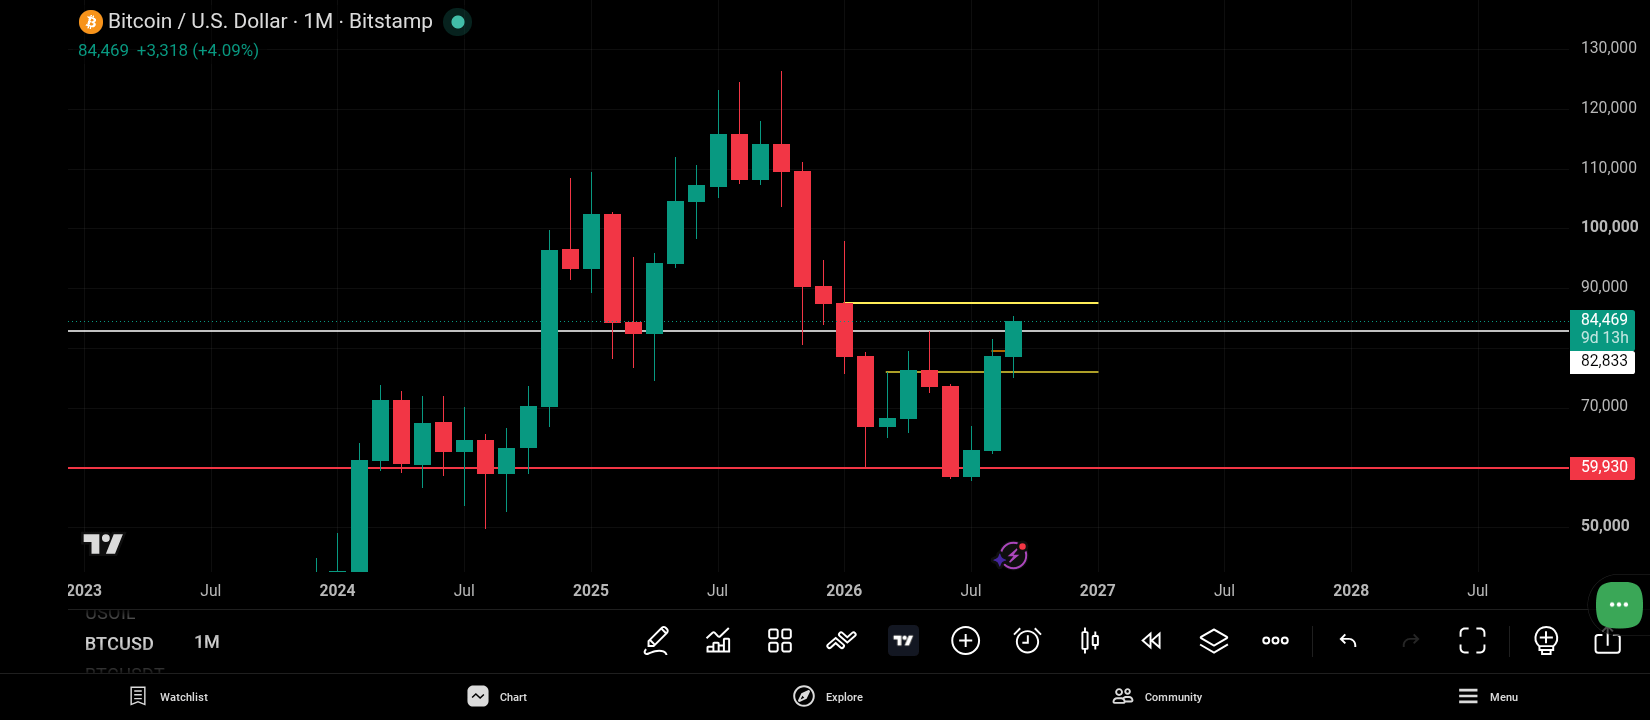
GM everyone, welcome to another episode of my weekly article. While writing this article, $BTC traded from 81.8K to 84K, so we’ll look at two charts: the previous one and the updated one.
For those who are new to my article, I use market profile and candlestick charts for analysis. Without further ado, let’s jump in.
Monthly Timeframe (1M)
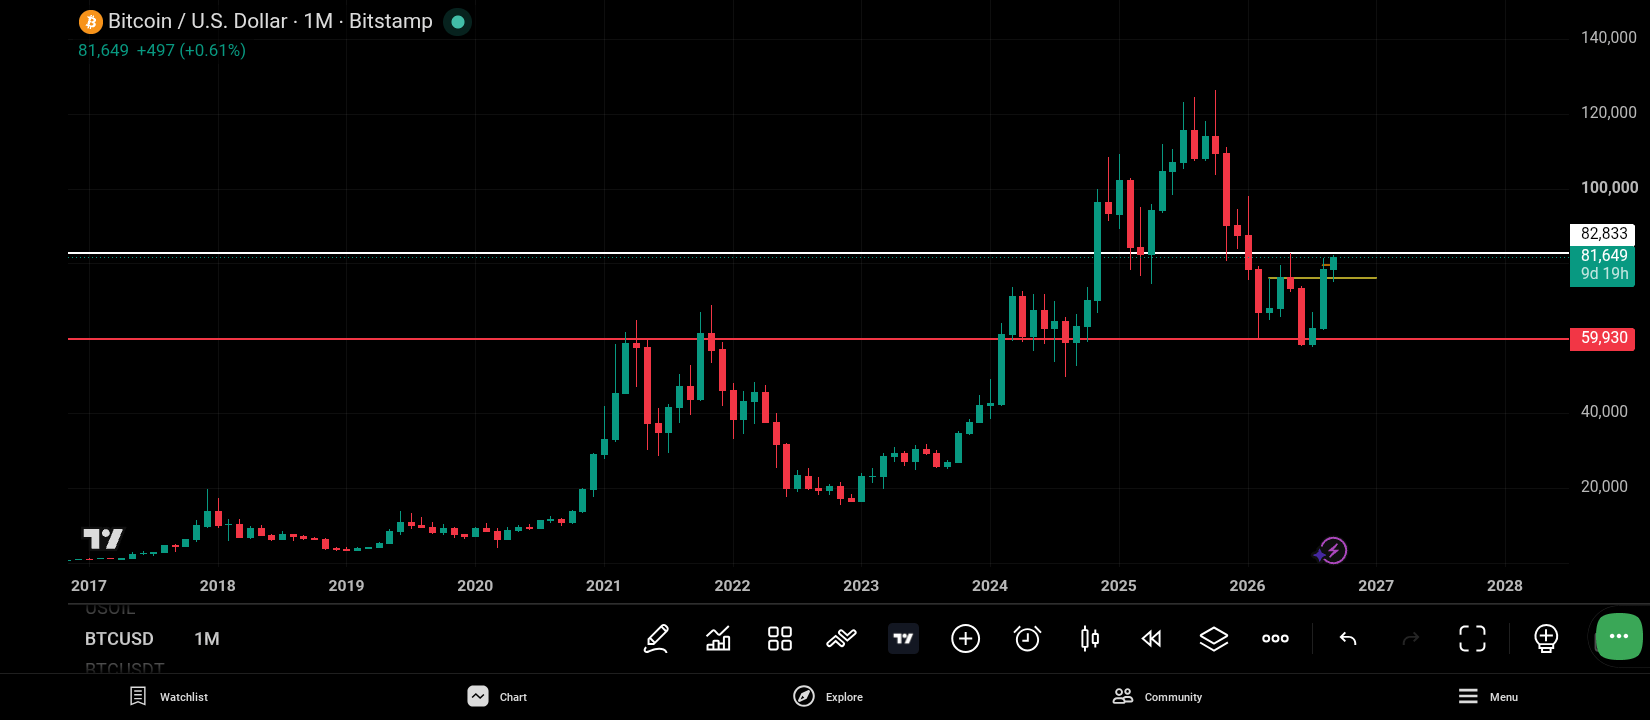
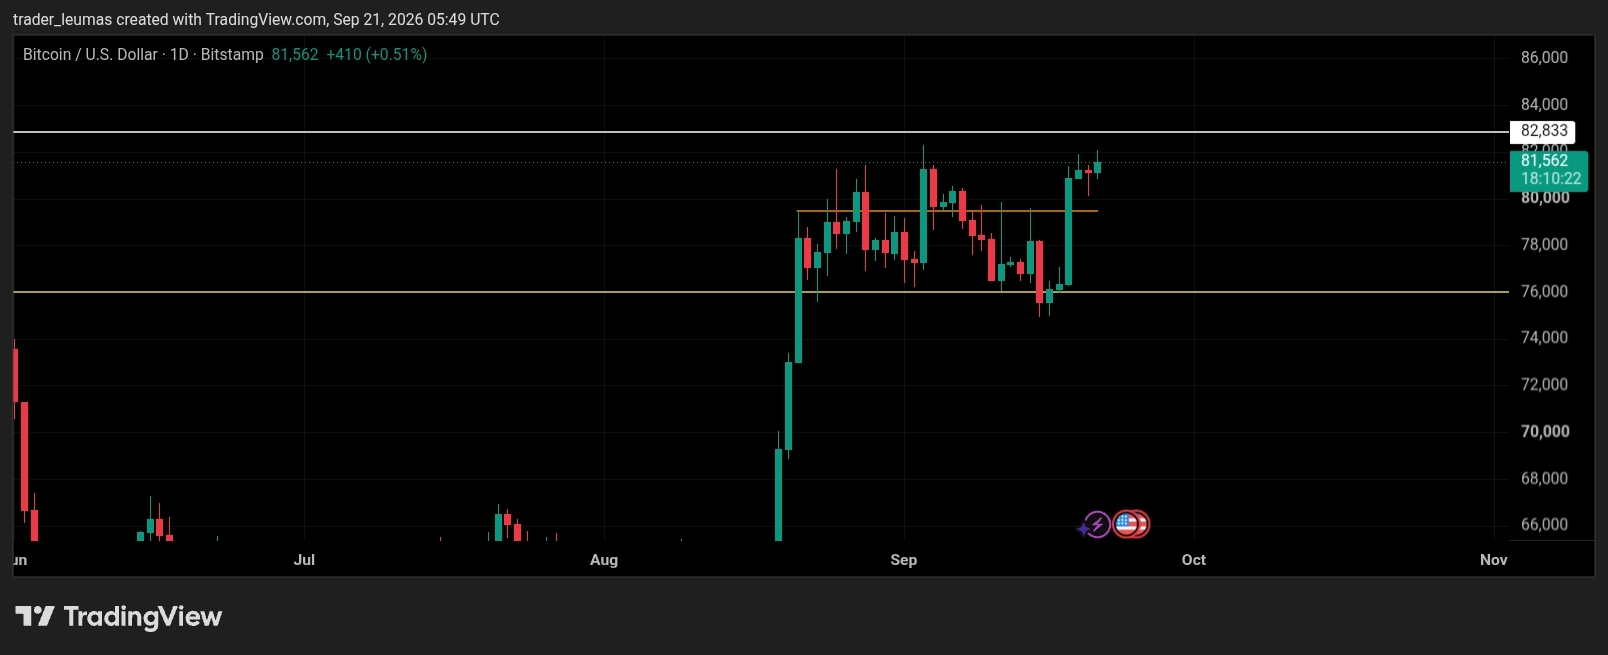
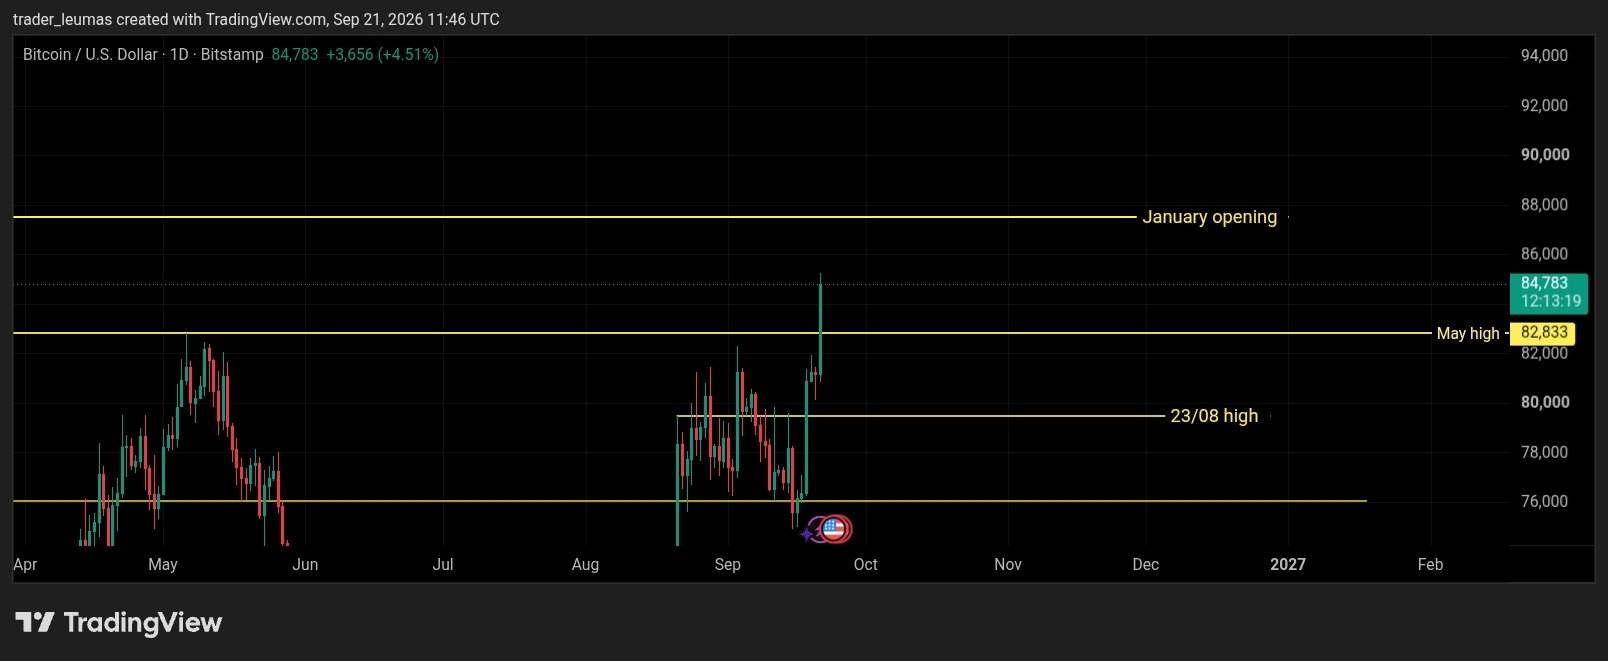
After the third week of August’s rally, I wrote in my article that the current uptrend was still young and that the market had moved from a narrow range to a wide range. Fast forward to this month, $BTC is now trading above the 82.8K high for the first time since May.
Intermediate Timeframe (1W)
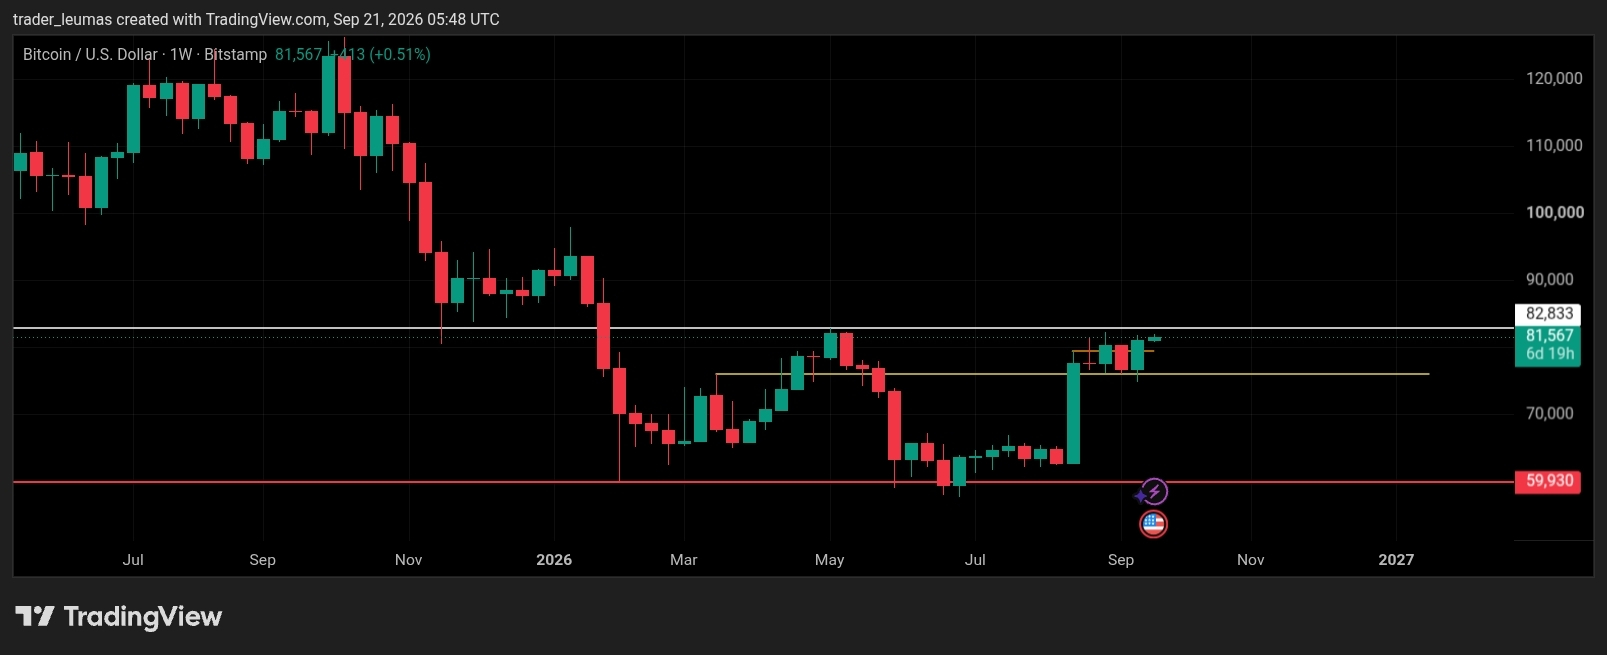
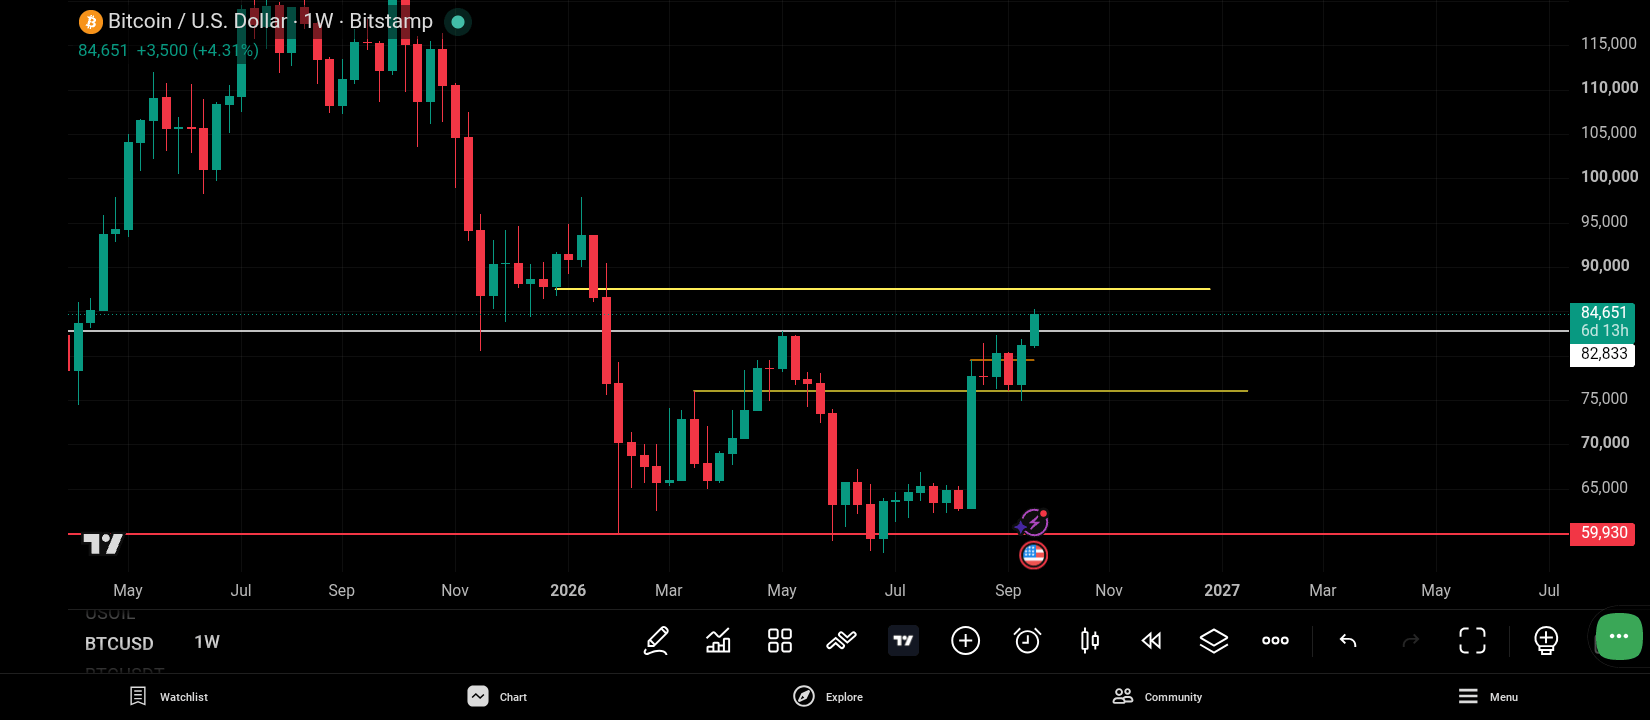
I really like how the market started off strong. Since the third week of august rally high, the market came into balance and timeframed lower for four straight weeks. Since $BTC is trading within the January range, let’s watch and see if the breakout is genuine and can hold. $BTC reaching 100K might be visible this year.
Daily Timeframe (1D)
In my last article, I talked about the market behavioral pattern: imbalance > balance > test > imbalance. After the test, we are now back at imbalance. Before the market broke out, I wrote in my journal that I really liked the way the market opened, and that we might see a breakout from the May 82.8K high.
Since the breakout, I’ve shifted my support area to the 23/08 high.
Short Term Timeframe (m30)
Let’s start with a recap of the market from Thursday after the FOMC news.
On Thursday, after the FOMC news, the market didn’t react much, so I think that was when the bulls were accumulating more inventory. The profile had a weak high, coupled with a poor low, which suggests unfinished business to the downside.
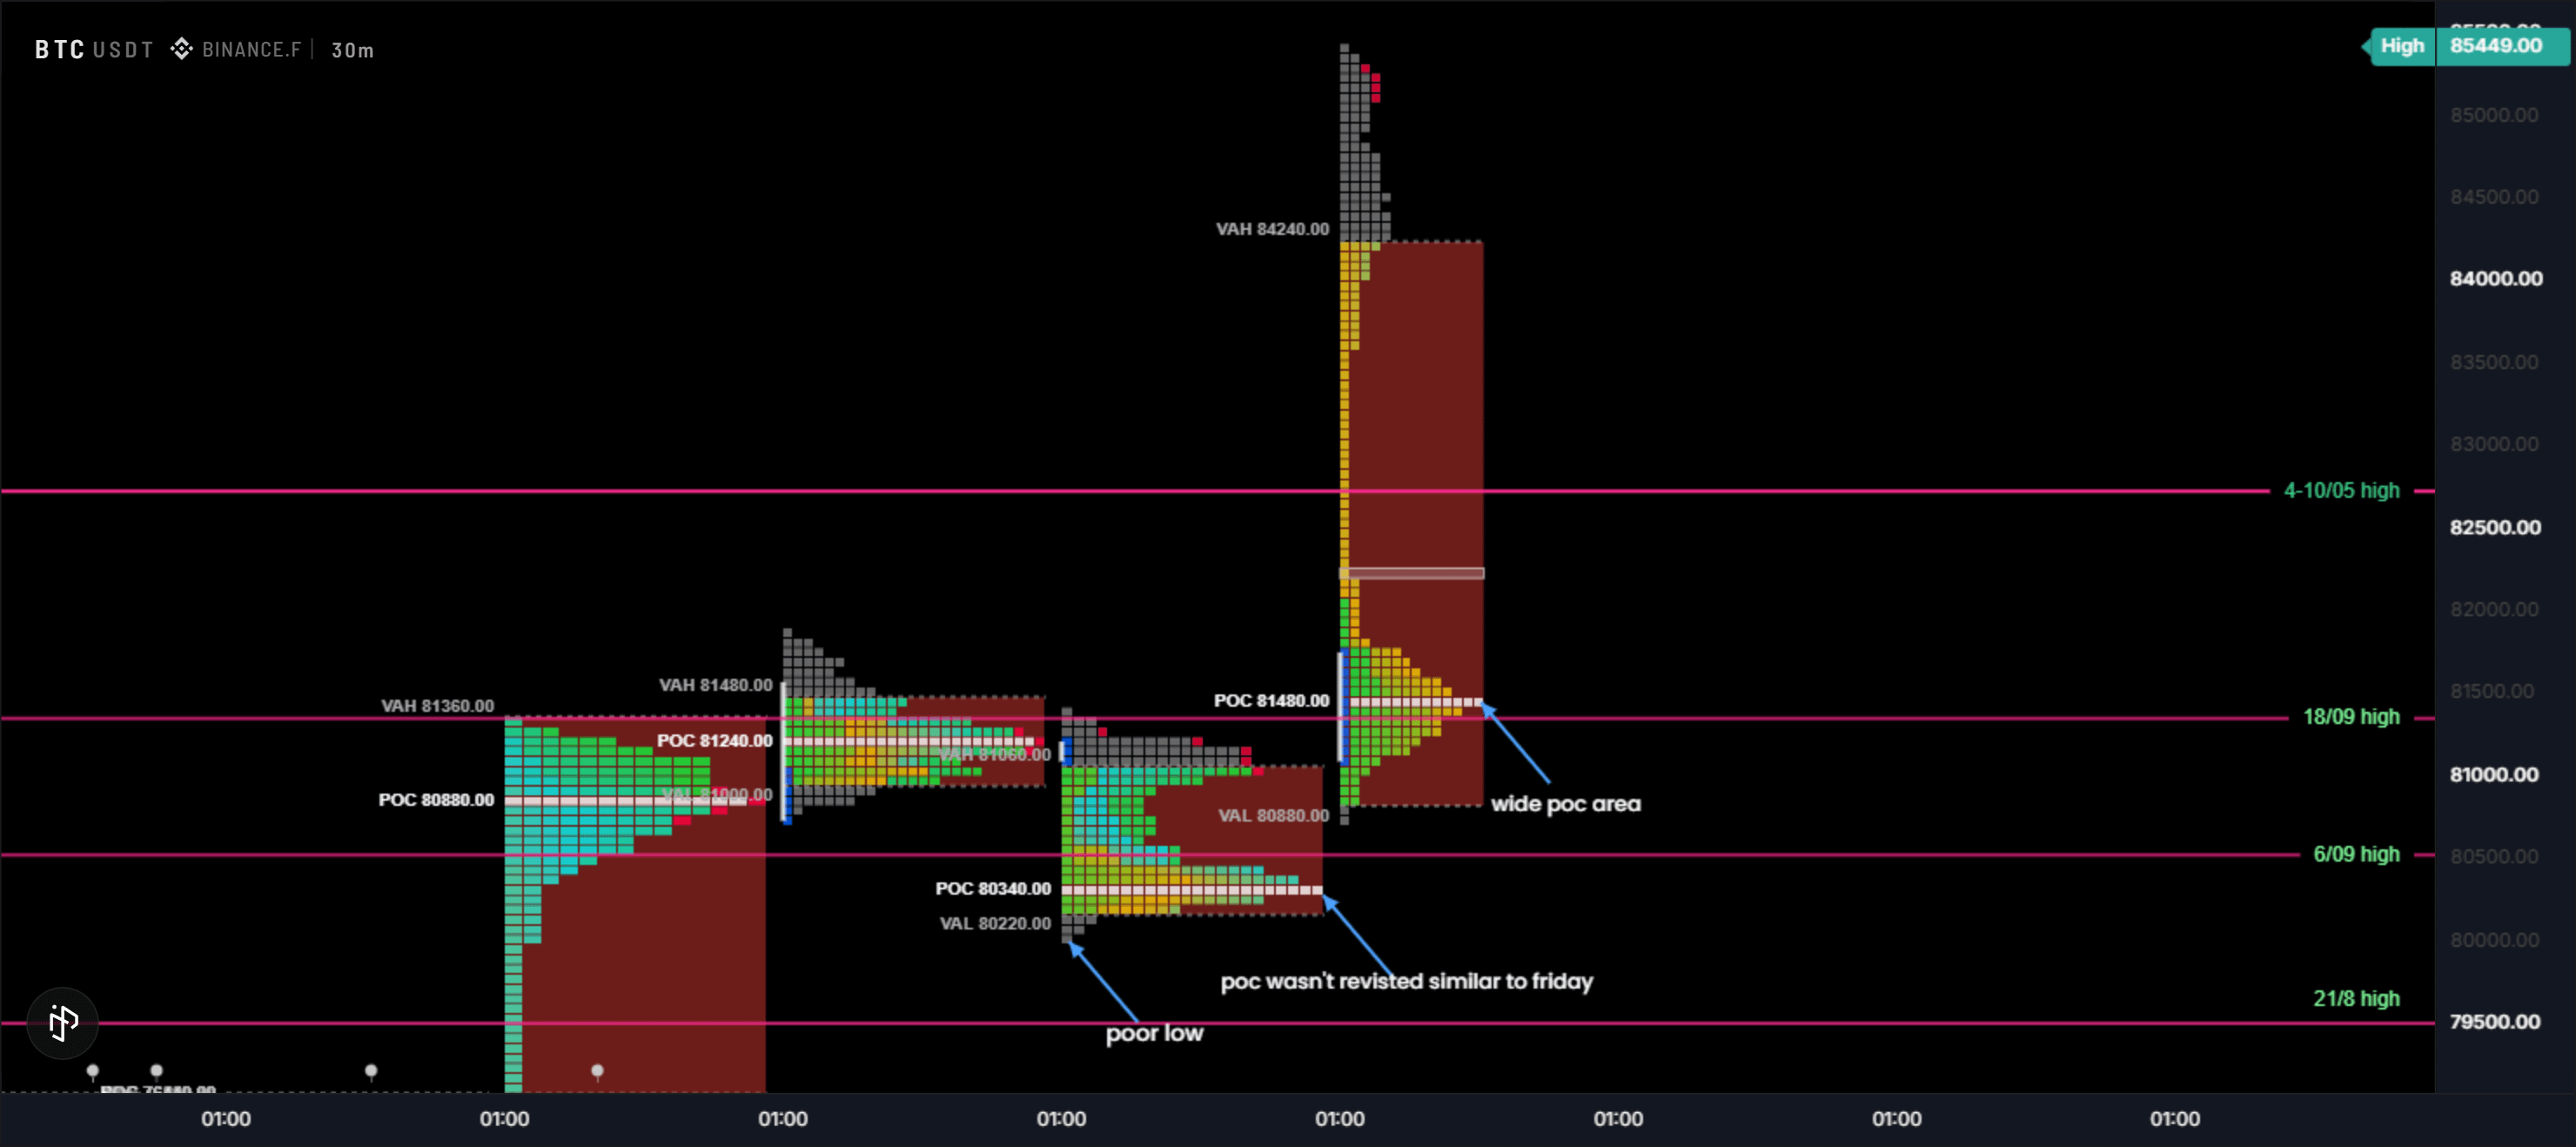
Friday, the market started strongly and showed a high confidence day. However, during the A and B periods, which make up the initial balance, the market formed a poor, weak low that was not revisited. the profile shape after the Asian session looked like a classical P shape. During NY session, new money extended the market upward, turning the short covering rally into a strong rally. The POC also migrated with price as price moved higher which also validated the move.
Saturday, the market came into balance while Sunday the market one timeframed lower and brought in buyers. The buyers where able to push the price back the opening period.
currently the market is trading within January range.
Today’s Profile Update
The market opened above the previous day’s value area high and traded sideways during the first periods. The open was similar to last Thursday’s, although both opens had different strength. Around mid morning, the market broke above the May 82.8K high, which increased market confidence.
The bulls continue to dominate after Friday’s strong rally. However, the trend is still young, so let’s watch how far price can go as higher levels continue to attract more activity.
Market Generated Information
The previous day’s poor low was not revisited.
The previous day’s POC area was too wide and was not revisited.
The current POC is not migrating with price as price moves higher.
Higher prices continue to attract more activity.
There are too many single prints.
Possible trade areas this week
High
1/1 opening
LOW
5/05 high
23/08 high.
Overall, the bulls are still in control, but the trend is still young. I’ll be watching closely to see whether higher prices continue to attract enough activity to extend the move further.
Thanks for reading,
What do you think about the market?