🔻 Wedge Patterns
Ever seen Bitcoin moving inside a tightening range, with the highs and lows slowly coming closer together?
That could be a Wedge Pattern.
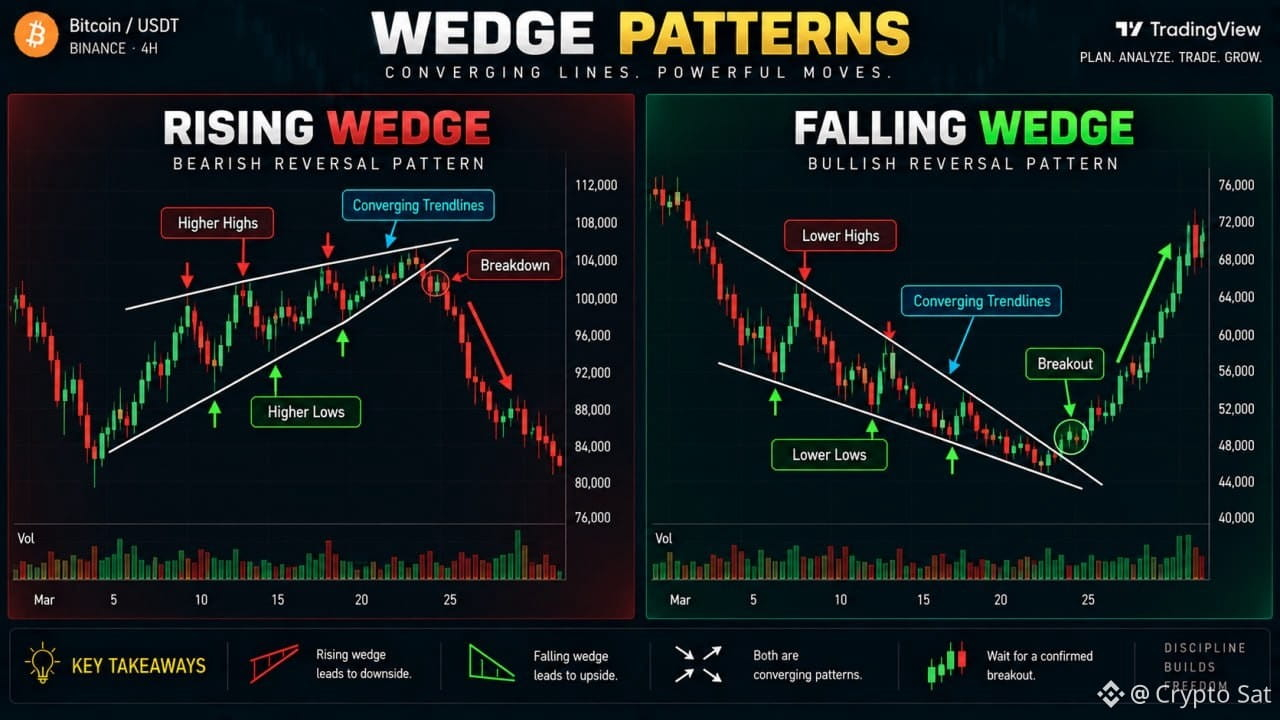
Wedges form when two converging trendlines squeeze price into a smaller and smaller range.
There are two main types:
1️⃣ Rising Wedge
A Rising Wedge forms when both highs and lows are moving upward, but the range is getting tighter.
Price keeps climbing, but momentum may be weakening as the swings become compressed.
It can have a bearish implication, especially when it forms after an extended rally.
Example:
$BTC → $90K → $95K → $98K
But each move becomes weaker and more compressed.
A breakdown below the lower trendline can signal potential bearish momentum.
2️⃣ Falling Wedge
A Falling Wedge forms when both highs and lows are moving downward while the range contracts.
Sellers are still pushing price lower, but selling momentum may be weakening.
It can have a bullish implication, particularly after a prolonged decline.
For example:
BTC falls from $100K → $94K → $90K, but each move becomes increasingly compressed.
A breakout above the upper trendline can signal potential bullish momentum.
⚠️ Don't Trade the Shape Alone
This is where beginners often get trapped.
❌ Rising wedge ≠ guaranteed dump
❌ Falling wedge ≠ guaranteed pump
Wait for a confirmed breakout or breakdown.
Look for:
▪️ Strong candle close outside the wedge
▪️ Volume confirmation
▪️ Retest of the broken trendline
▪️ Supporting market structure
Remember:
•The wedge shows compression.
•The breakout shows direction.
•Confirmation gives you confidence.
Don't predict the breakout. Let price confirm the move first. 🚀
Ever seen Bitcoin moving inside a tightening range, with the highs and lows slowly coming closer together?
That could be a Wedge Pattern.
Wedges form when two converging trendlines squeeze price into a smaller and smaller range.
There are two main types:
1️⃣ Rising Wedge
A Rising Wedge forms when both highs and lows are moving upward, but the range is getting tighter.
Price keeps climbing, but momentum may be weakening as the swings become compressed.
It can have a bearish implication, especially when it forms after an extended rally.
Example:
$BTC → $90K → $95K → $98K
But each move becomes weaker and more compressed.
A breakdown below the lower trendline can signal potential bearish momentum.
2️⃣ Falling Wedge
A Falling Wedge forms when both highs and lows are moving downward while the range contracts.
Sellers are still pushing price lower, but selling momentum may be weakening.
It can have a bullish implication, particularly after a prolonged decline.
For example:
BTC falls from $100K → $94K → $90K, but each move becomes increasingly compressed.
A breakout above the upper trendline can signal potential bullish momentum.
⚠️ Don't Trade the Shape Alone
This is where beginners often get trapped.
❌ Rising wedge ≠ guaranteed dump
❌ Falling wedge ≠ guaranteed pump
Wait for a confirmed breakout or breakdown.
Look for:
▪️ Strong candle close outside the wedge
▪️ Volume confirmation
▪️ Retest of the broken trendline
▪️ Supporting market structure
Remember:
•The wedge shows compression.
•The breakout shows direction.
•Confirmation gives you confidence.
Don't predict the breakout. Let price confirm the move first. 🚀