🟦 RENDER IS SITTING ON A MULTI-MONTH BASE
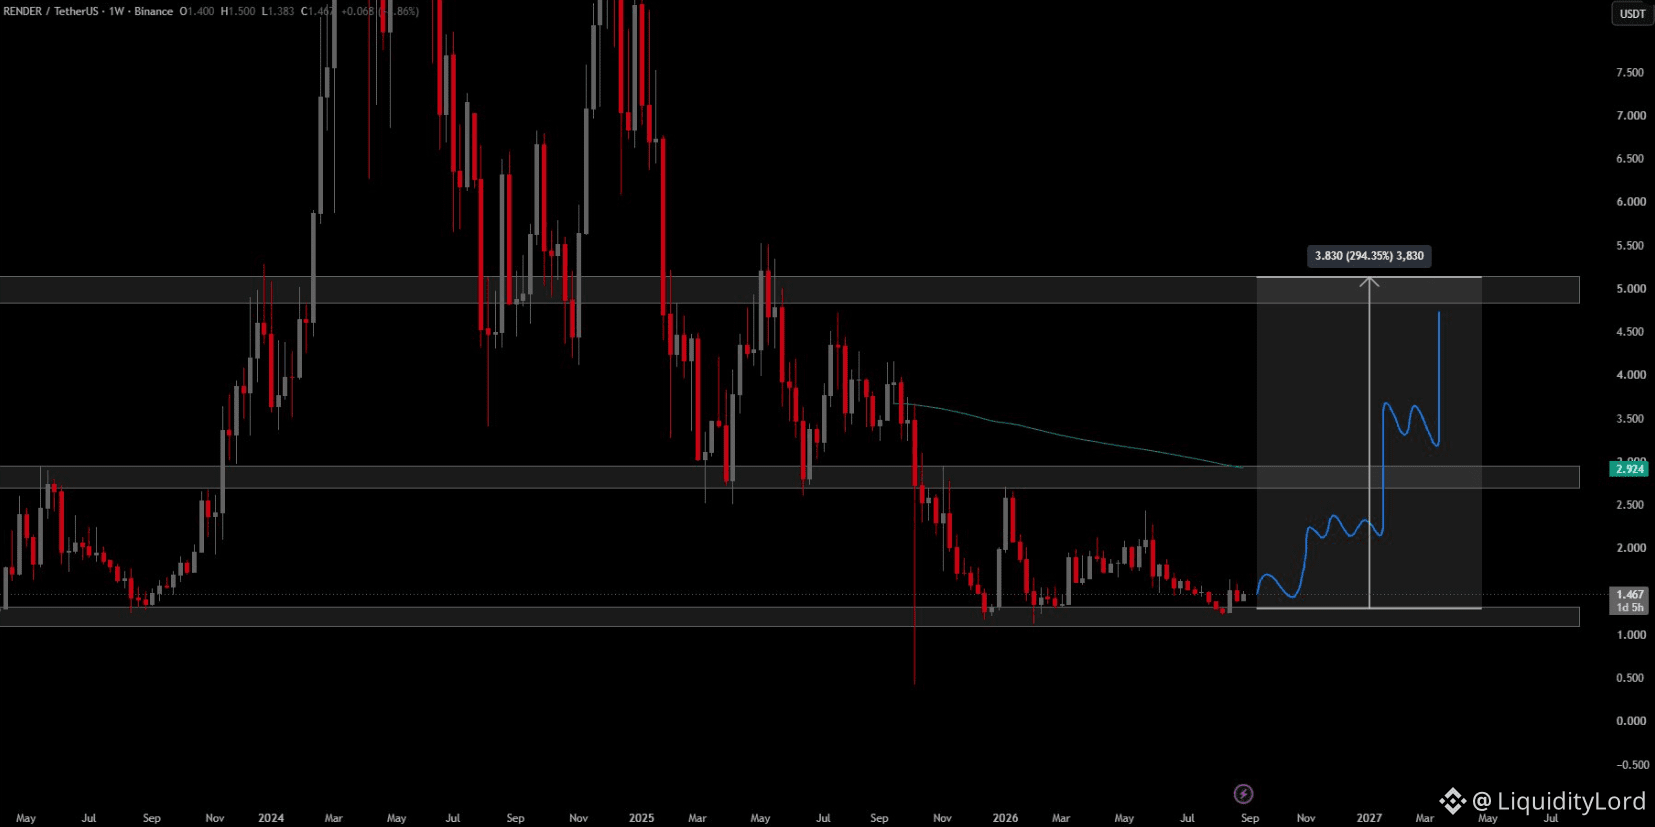
RENDER/USDT on the 1W chart is around 1.47 after a prolonged decline from the 2024–25 highs. Price has spent months compressing near the lower demand band, while the descending trendline continues to define the broader structure. The chart is outlining a possible recovery path, but the weekly trend remains unresolved. The base can hold without producing a confirmed breakout.
🧭 THE WEEKLY MAP
The first major floor is the 1.20–1.45 region. Price has repeatedly reacted around this area, and the latest candles are pressing against its upper edge.
Above it sits the 2.65–2.95 resistance band. It overlaps with the descending trendline, making a reclaim structurally important.
Beyond that, the marked upper supply zone is around 4.80–5.10.
📐 THE ROUTE I AM WATCHING
1.20–1.45 → base / reaction area
1.10 → deeper invalidation
2.65–2.95 → breakout gate
3.50 → intermediate objective
4.80–5.10 → major target zone
I would not treat the blue projection as a forecast. A hold above 1.20–1.45 followed by a weekly reclaim of 2.65–2.95 would provide the first meaningful structural confirmation. From there, 3.50 becomes the next checkpoint, with 4.80–5.10 as the larger mapped area. Failure there keeps the market inside its broader range.
⚠ WHAT BREAKS THE IDEA
A decisive weekly loss of the lower base would weaken the accumulation thesis and invalidate the recovery structure I am tracking. Until price clears the descending trendline, this remains a potential reversal, not a confirmed trend change.
🔗 ONE DEFI ANGLE
ST0Nfi gives me a separate infrastructure lens around decentralized liquidity and execution. I keep that protocol context independent from RENDER price action; it is not a signal that the chart must follow the projected path.
The key is simple: defend the base, reclaim the trendline, then attack the upper range. Confirmation has to come first.
NFA - DYOR
$RENDER
RENDER/USDT on the 1W chart is around 1.47 after a prolonged decline from the 2024–25 highs. Price has spent months compressing near the lower demand band, while the descending trendline continues to define the broader structure. The chart is outlining a possible recovery path, but the weekly trend remains unresolved. The base can hold without producing a confirmed breakout.
🧭 THE WEEKLY MAP
The first major floor is the 1.20–1.45 region. Price has repeatedly reacted around this area, and the latest candles are pressing against its upper edge.
Above it sits the 2.65–2.95 resistance band. It overlaps with the descending trendline, making a reclaim structurally important.
Beyond that, the marked upper supply zone is around 4.80–5.10.
📐 THE ROUTE I AM WATCHING
1.20–1.45 → base / reaction area
1.10 → deeper invalidation
2.65–2.95 → breakout gate
3.50 → intermediate objective
4.80–5.10 → major target zone
I would not treat the blue projection as a forecast. A hold above 1.20–1.45 followed by a weekly reclaim of 2.65–2.95 would provide the first meaningful structural confirmation. From there, 3.50 becomes the next checkpoint, with 4.80–5.10 as the larger mapped area. Failure there keeps the market inside its broader range.
⚠ WHAT BREAKS THE IDEA
A decisive weekly loss of the lower base would weaken the accumulation thesis and invalidate the recovery structure I am tracking. Until price clears the descending trendline, this remains a potential reversal, not a confirmed trend change.
🔗 ONE DEFI ANGLE
ST0Nfi gives me a separate infrastructure lens around decentralized liquidity and execution. I keep that protocol context independent from RENDER price action; it is not a signal that the chart must follow the projected path.
The key is simple: defend the base, reclaim the trendline, then attack the upper range. Confirmation has to come first.
NFA - DYOR
$RENDER