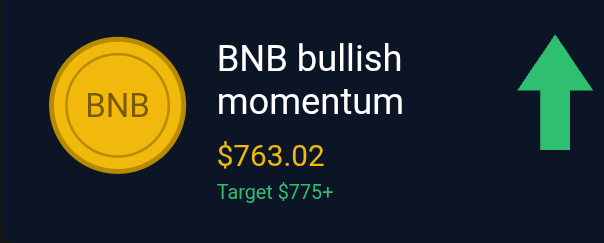

$BNB is holding firm above its key moving averages, and the chart is setting up for a possible breakout toward **$775+**. 🎯 Here's the full breakdown on the 15-minute timeframe. 👇
## 📊 Market Analysis (BNB/USDT, 15m)
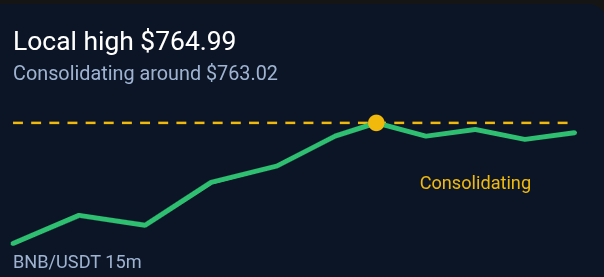
BNB recently hit a **local high of $764.99** and is now **consolidating around $763.02**. 🔥 Instead of dropping hard after the push up, price is holding near the highs. That usually shows buyers are not in a hurry to exit. 💪
## 📉📈 Moving Averages Check
📌 **MA7:** $760.59
📌 **MA25:** $754.82
📌 **MA99:** $756.21
Price is trading **above all three moving averages**, and the short-term MA7 is leading the pack. 🟢 That points to buyer control and potential for upside continuation. Holding above these averages is what keeps the bullish structure intact. 🛡️
## 🎯 Trade Setup (BNB/USDT)
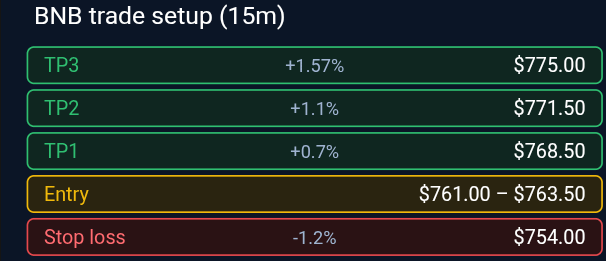
🟢 **Entry Zone:** $761.00 – $763.50
🔴 **Stop Loss (SL):** $754.00
🎯 **Take Profit 1 (TP1):** $768.50
🎯 **Take Profit 2 (TP2):** $771.50
🎯 **Take Profit 3 (TP3):** $775.00 (+1.57%)
## 🧮 Understanding the Numbers
Measured from the current price of about $763.02:
➡️ **TP1** is roughly **+0.7%** 📍
➡️ **TP2** is roughly **+1.1%** 📍
➡️ **TP3** is roughly **+1.57%** 🏁
➡️ **Stop loss** is roughly **-1.2%** 🛑
The stop loss sits just below the moving average cluster. If price falls back under that zone, the bullish idea is weakened, and the setup is no longer valid. ⚠️
## 🧠 How to Trade This Setup Wisely
✅ **Don't chase.** Wait for price to trade inside the entry zone instead of buying a sudden spike. 🎯
✅ **Check your risk/reward.** Entering near the top of the zone gives a tighter reward compared to the stop. Entering nearer $761 improves it. ⚖️
✅ **Take partial profits.** Scaling out at TP1, TP2 and TP3 can help lock in gains. 💰
✅ **Respect the stop loss.** A plan without a stop is just a hope. 🛡️
✅ **Watch the market.** BTC direction and overall sentiment can change a short-term setup quickly. 👀
## 🔥 Two Scenarios
🟢 **Bullish case:** BNB keeps holding above the moving averages, breaks the $764.99 local high with volume, and moves toward TP1, TP2 and TP3. 🚀
🔴 **Cautious case:** Price loses the moving average zone and slips toward $754. In that case, the setup fails, and it's better to stay disciplined and step aside. 📉
## ⏱️ Keep the Timeframe in Mind
This analysis is based on the **15-minute chart**, which means it's a **short-term** view. Levels can change fast, so always check the live chart before acting. ⚡
## 💬 Final Thoughts
BNB is showing steady strength: a fresh local high, tight consolidation and price sitting above key averages. 🐂 The real confirmation comes if buyers break above **$764.99** and keep the momentum going toward **$775**.
So what's your plan? 🤔 Are you **entering in the zone** or **waiting for the breakout to confirm**? Tell me in the comments! 👇
⚠️ *Not financial advice. Always do your own research and manage your risk.* 🛡️
**#BNB #BNBUSDT #chain #TechnicalAnalysis #ZECUSDT *
---