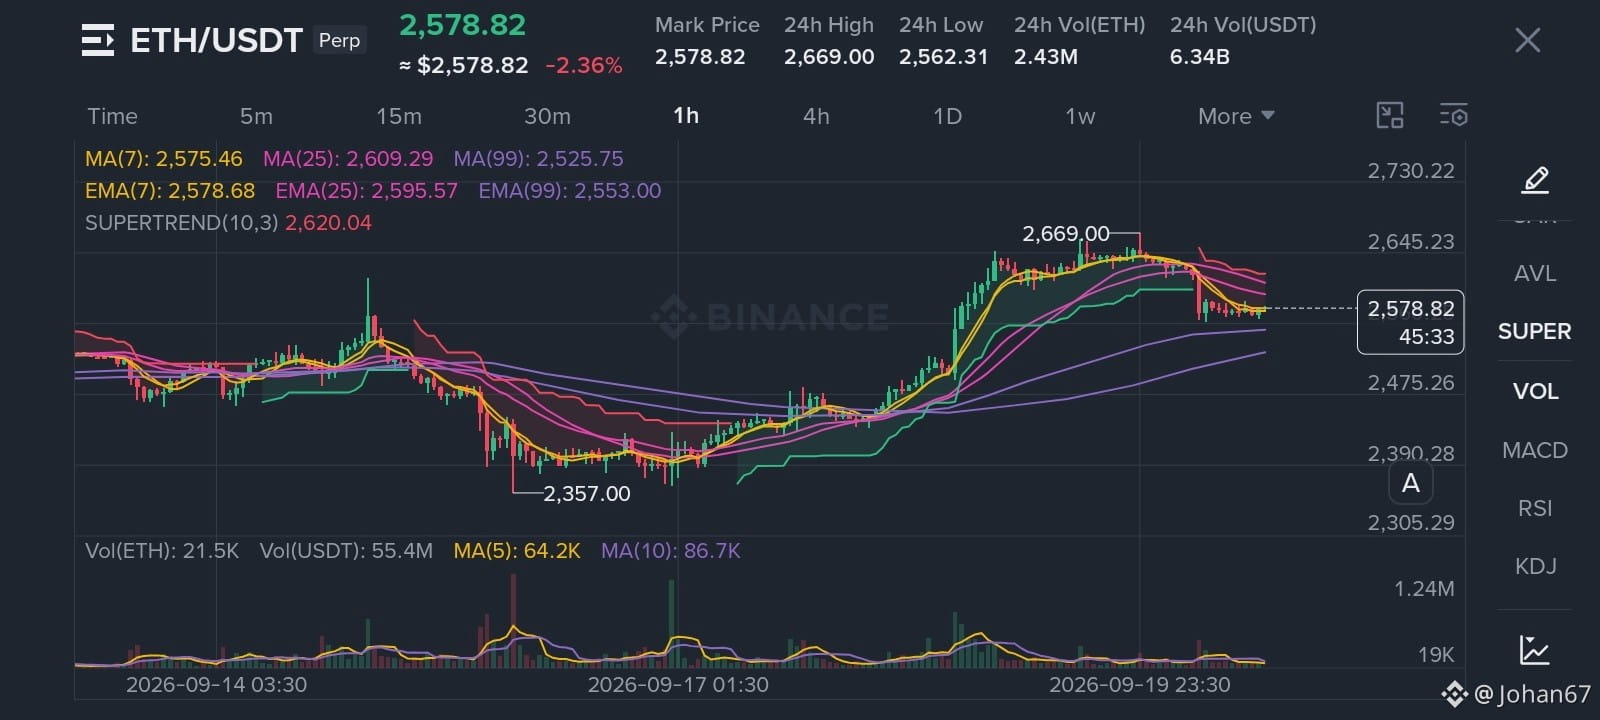
$ETH Core Bias: Bearish (🔴Short)
Current Market Price: ~$2,578
Multi-Timeframe Analysis
1️⃣ 4H — Higher Timeframe (HTF)
Price created a new high at $2,669 (Buy-side Liquidity / Recent High) before pulling back.
A strong bearish displacement followed from that high.
However, the overall 4H market structure hasn't fully shifted to bearish yet.
While taking a Short is not strictly trading against the primary HTF trend, it is crucial to remain cautious as this could be an HTF pullback phase.
2️⃣ 1H — Clearer Structure
Moves from $2,669 formed a sequence of Lower Highs -> Lower Lows, pushing down aggressively toward ~$2,560.
Current 1H structure demonstrates sustained bearish pressure.
3️⃣ 15M — Key Timeframe
A powerful bearish displacement originated around $2,638, dropping to $2,562.31.
The $2,562.31 level acts as Sell-side Liquidity (SSL).
Price swept this level and bounced; however, a liquidity sweep alone is not a valid Long signal.
A bullish MSS/BOS confirmed with a candle body close is required before considering any Long position.
4️⃣ 5M — Execution Level
Price bounced off the $2,562.31 low and is currently consolidating/ranging around $2,578.
Executing a market sell at $2,578 is not recommended—the major displacement has already occurred, and entering here risks chasing the move.
🎯 Trade Setup: Pullback Short
Entry Zone: $2,590 – $2,600
Stop Loss (SL): $2,613
Take Profit 1 (TP1): $2,562
Take Profit 2 (TP2): $2,550
Take Profit 3 (TP3): $2,522
Risk/Reward Profile
Example Entry: $2,595 | SL: $2,613 -> Risk: 18 points
TP2 ($2,550): Reward = 45 points -> RR approx 1:2.5
TP3 ($2,522): Reward = 73 points -> RR approx 1:4
⚠️ Strict Entry Execution Rules
Do not execute a market order as soon as price enters $2,590–$2,600. Follow this precise sequence:
Liquidity / Premium Zone -> 5M Bearish MSS/BOS -> Candle Body Close -> FVG / OB Retest -> ENTRY
Execution Example:
Price retraces up into $2,595 and shows rejection.
5M chart breaks below the previous low with a candle body close.
A bearish FVG or Order Block (OB) is formed.
Current Market Price: ~$2,578
Multi-Timeframe Analysis
1️⃣ 4H — Higher Timeframe (HTF)
Price created a new high at $2,669 (Buy-side Liquidity / Recent High) before pulling back.
A strong bearish displacement followed from that high.
However, the overall 4H market structure hasn't fully shifted to bearish yet.
While taking a Short is not strictly trading against the primary HTF trend, it is crucial to remain cautious as this could be an HTF pullback phase.
2️⃣ 1H — Clearer Structure
Moves from $2,669 formed a sequence of Lower Highs -> Lower Lows, pushing down aggressively toward ~$2,560.
Current 1H structure demonstrates sustained bearish pressure.
3️⃣ 15M — Key Timeframe
A powerful bearish displacement originated around $2,638, dropping to $2,562.31.
The $2,562.31 level acts as Sell-side Liquidity (SSL).
Price swept this level and bounced; however, a liquidity sweep alone is not a valid Long signal.
A bullish MSS/BOS confirmed with a candle body close is required before considering any Long position.
4️⃣ 5M — Execution Level
Price bounced off the $2,562.31 low and is currently consolidating/ranging around $2,578.
Executing a market sell at $2,578 is not recommended—the major displacement has already occurred, and entering here risks chasing the move.
🎯 Trade Setup: Pullback Short
Entry Zone: $2,590 – $2,600
Stop Loss (SL): $2,613
Take Profit 1 (TP1): $2,562
Take Profit 2 (TP2): $2,550
Take Profit 3 (TP3): $2,522
Risk/Reward Profile
Example Entry: $2,595 | SL: $2,613 -> Risk: 18 points
TP2 ($2,550): Reward = 45 points -> RR approx 1:2.5
TP3 ($2,522): Reward = 73 points -> RR approx 1:4
⚠️ Strict Entry Execution Rules
Do not execute a market order as soon as price enters $2,590–$2,600. Follow this precise sequence:
Liquidity / Premium Zone -> 5M Bearish MSS/BOS -> Candle Body Close -> FVG / OB Retest -> ENTRY
Execution Example:
Price retraces up into $2,595 and shows rejection.
5M chart breaks below the previous low with a candle body close.
A bearish FVG or Order Block (OB) is formed.