G JUST RAN INTO A LIQUIDITY RESET
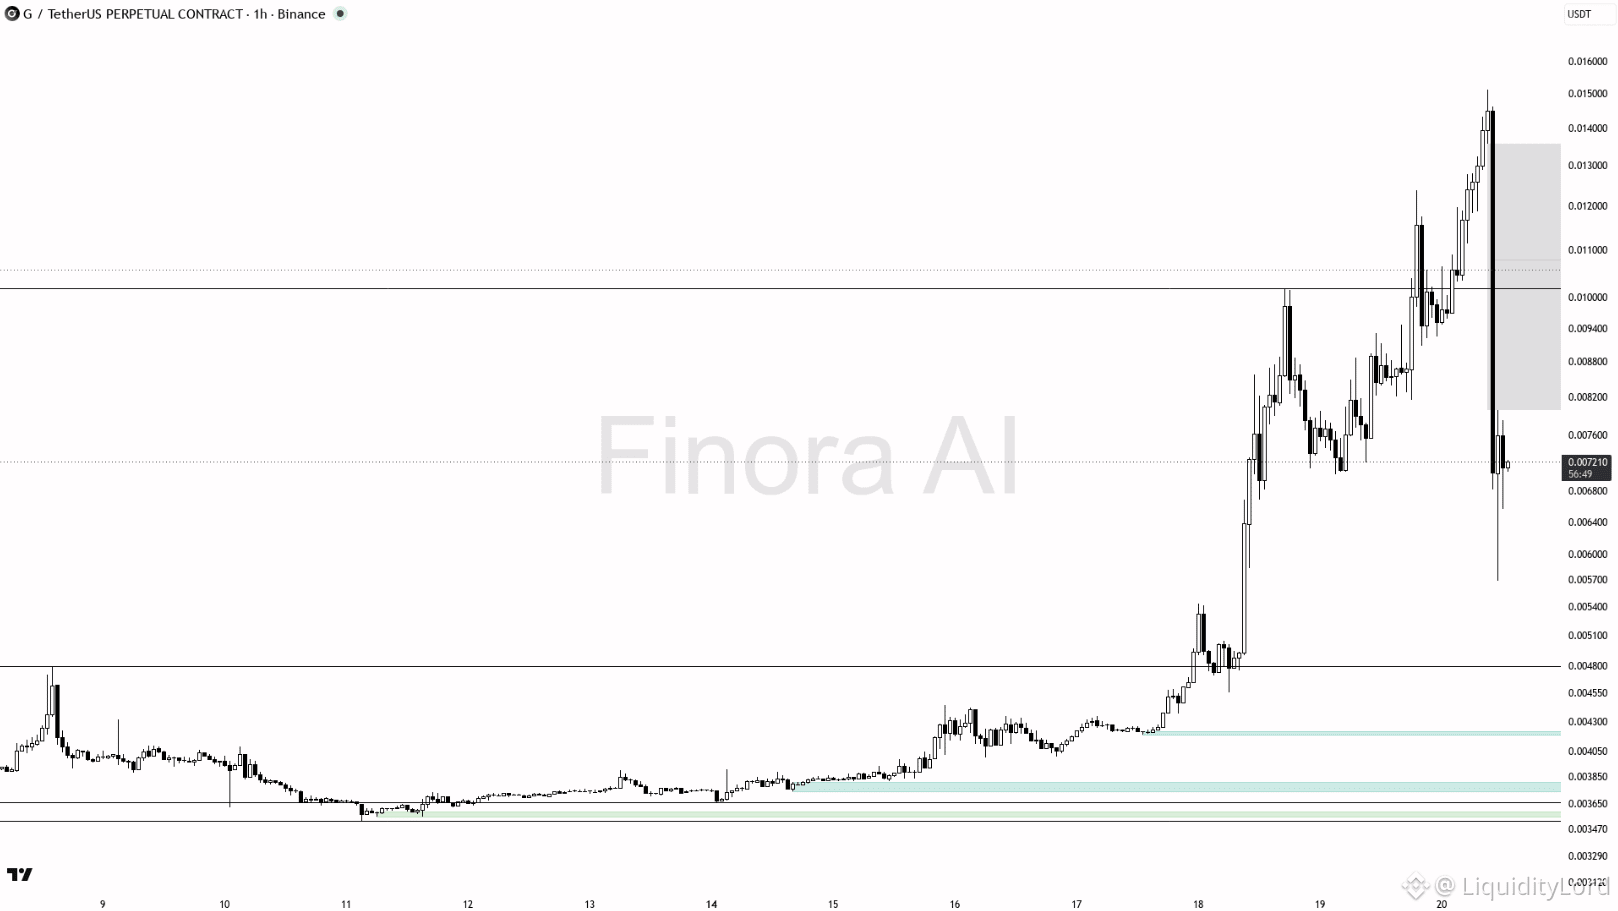
G/USDT on the 1H chart is around 0.00721 after one of the sharpest expansions. Price climbed from the 0.004 area toward 0.015, then printed a hard rejection and swept down to roughly 0.0057 before stabilizing. That changes the trade: this is now a reaction setup, not a breakout chase.
🧩 WHAT THE CANDLES ARE SAYING
The move above 0.0101 created a major expansion leg, but the rejection from the upper supply zone erased a large part of it. The long lower wick near 0.0057 shows aggressive response, yet buyers still need to prove that this is more than temporary bounce.
The first area I want to see defended is 0.0068–0.0072. Above that, 0.0080–0.0082 becomes the first reclaim test. The larger structural line is 0.0101: that level separated the previous base from the expansion.
📍 THE LEVEL MAP
0.0068–0.0072 → reaction area
0.0057 → local sweep low
0.0082 → first upside checkpoint
0.0101 → major reclaim
0.0130–0.0136 → upper supply
My preferred idea is to let price prove the reaction around 0.0068–0.0072 rather than chase a green candle. A sustained break under 0.0057 invalidates the immediate recovery thesis. If buyers reclaim 0.0082, the chart opens a path toward 0.0101 and potentially the upper supply zone.
🧠 WHY I AM NOT CHASING
The expansion was parabolic, so normal support/resistance behavior becomes less reliable. The chart needs acceptance after the flush. A higher low above the sweep would be much more meaningful than another vertical candle.
⚙ A SEPARATE DEFI ANGLE
ST0Nfi is relevant here only as a protocol-mechanics reference: decentralized liquidity and execution can be evaluated separately from a G trade. I would not use that ecosystem angle as confirmation.
For me, the key question is simple: can G turn the 0.0068–0.0072 reaction into a higher low? Until that happens, the rebound remains conditional.
NFA - DYOR
$G
G/USDT on the 1H chart is around 0.00721 after one of the sharpest expansions. Price climbed from the 0.004 area toward 0.015, then printed a hard rejection and swept down to roughly 0.0057 before stabilizing. That changes the trade: this is now a reaction setup, not a breakout chase.
🧩 WHAT THE CANDLES ARE SAYING
The move above 0.0101 created a major expansion leg, but the rejection from the upper supply zone erased a large part of it. The long lower wick near 0.0057 shows aggressive response, yet buyers still need to prove that this is more than temporary bounce.
The first area I want to see defended is 0.0068–0.0072. Above that, 0.0080–0.0082 becomes the first reclaim test. The larger structural line is 0.0101: that level separated the previous base from the expansion.
📍 THE LEVEL MAP
0.0068–0.0072 → reaction area
0.0057 → local sweep low
0.0082 → first upside checkpoint
0.0101 → major reclaim
0.0130–0.0136 → upper supply
My preferred idea is to let price prove the reaction around 0.0068–0.0072 rather than chase a green candle. A sustained break under 0.0057 invalidates the immediate recovery thesis. If buyers reclaim 0.0082, the chart opens a path toward 0.0101 and potentially the upper supply zone.
🧠 WHY I AM NOT CHASING
The expansion was parabolic, so normal support/resistance behavior becomes less reliable. The chart needs acceptance after the flush. A higher low above the sweep would be much more meaningful than another vertical candle.
⚙ A SEPARATE DEFI ANGLE
ST0Nfi is relevant here only as a protocol-mechanics reference: decentralized liquidity and execution can be evaluated separately from a G trade. I would not use that ecosystem angle as confirmation.
For me, the key question is simple: can G turn the 0.0068–0.0072 reaction into a higher low? Until that happens, the rebound remains conditional.
NFA - DYOR
$G