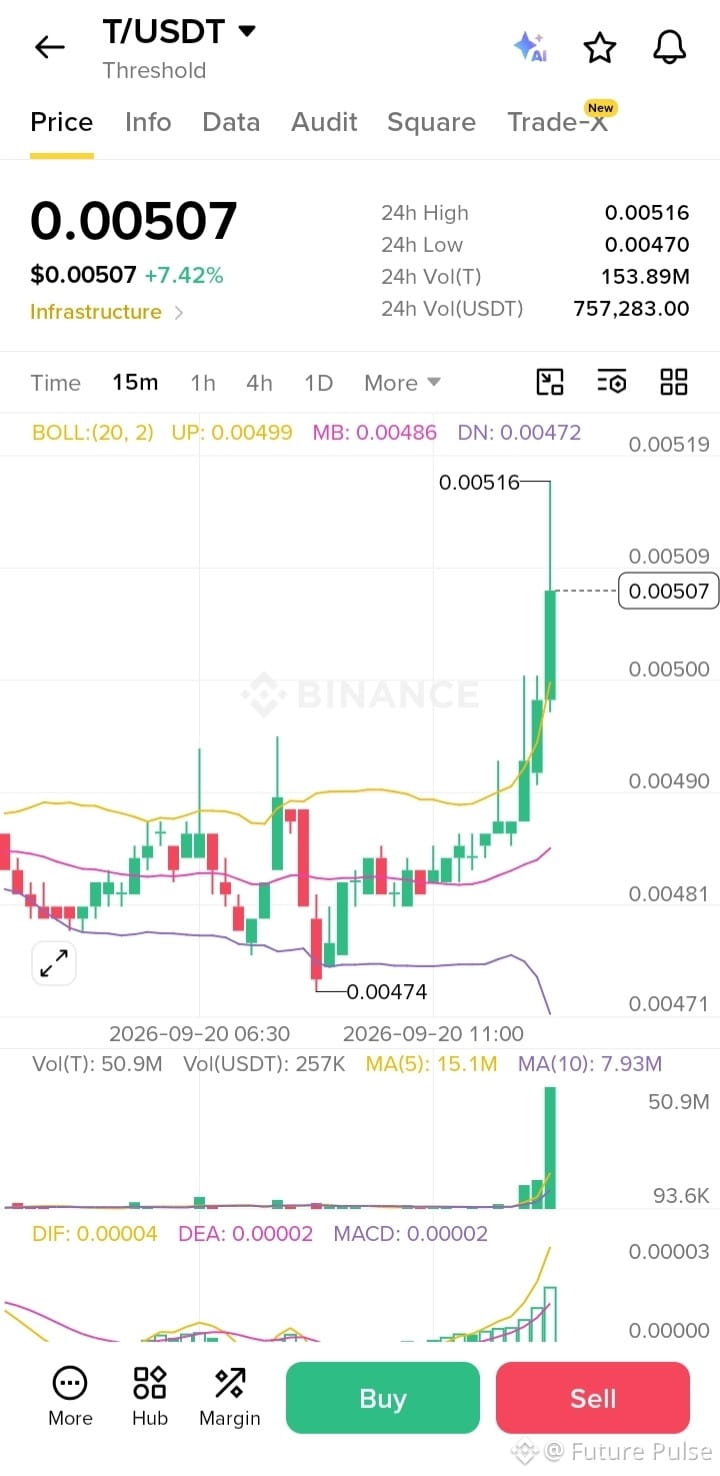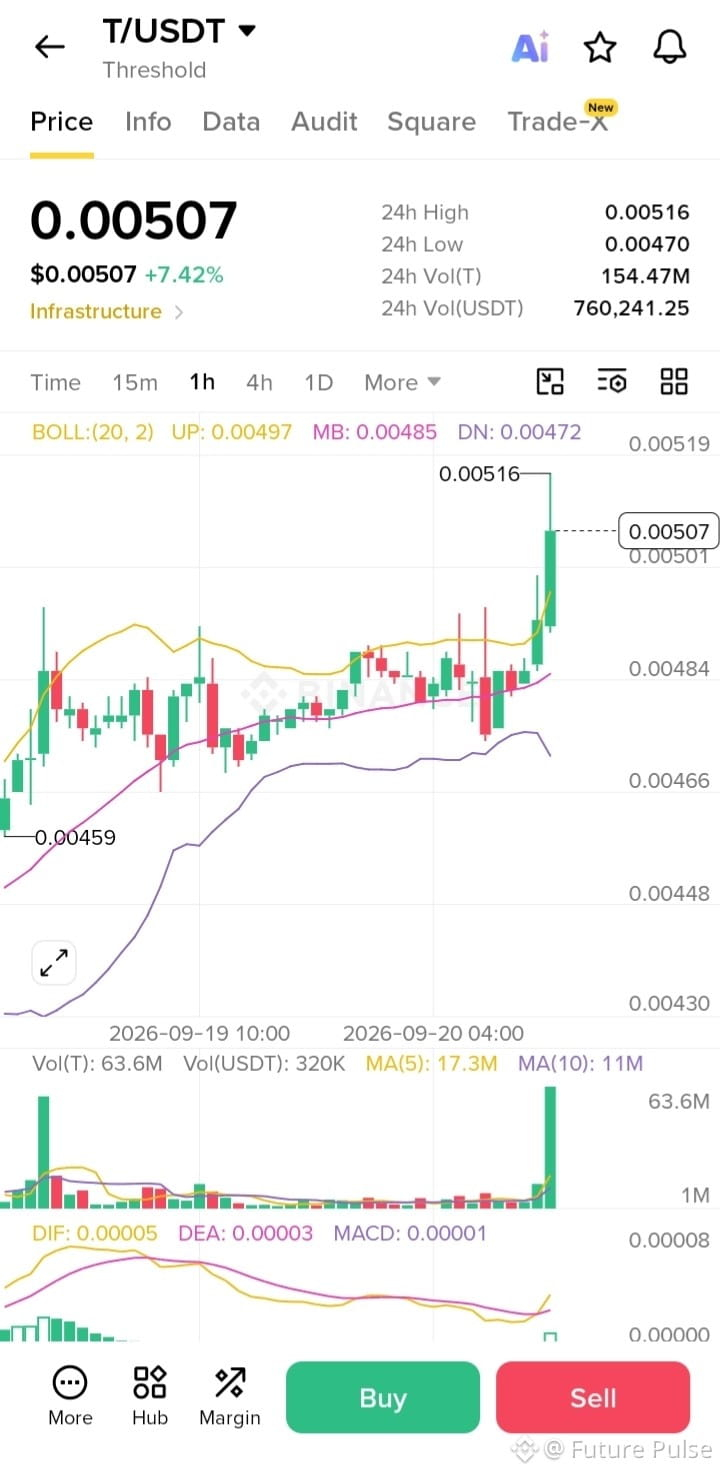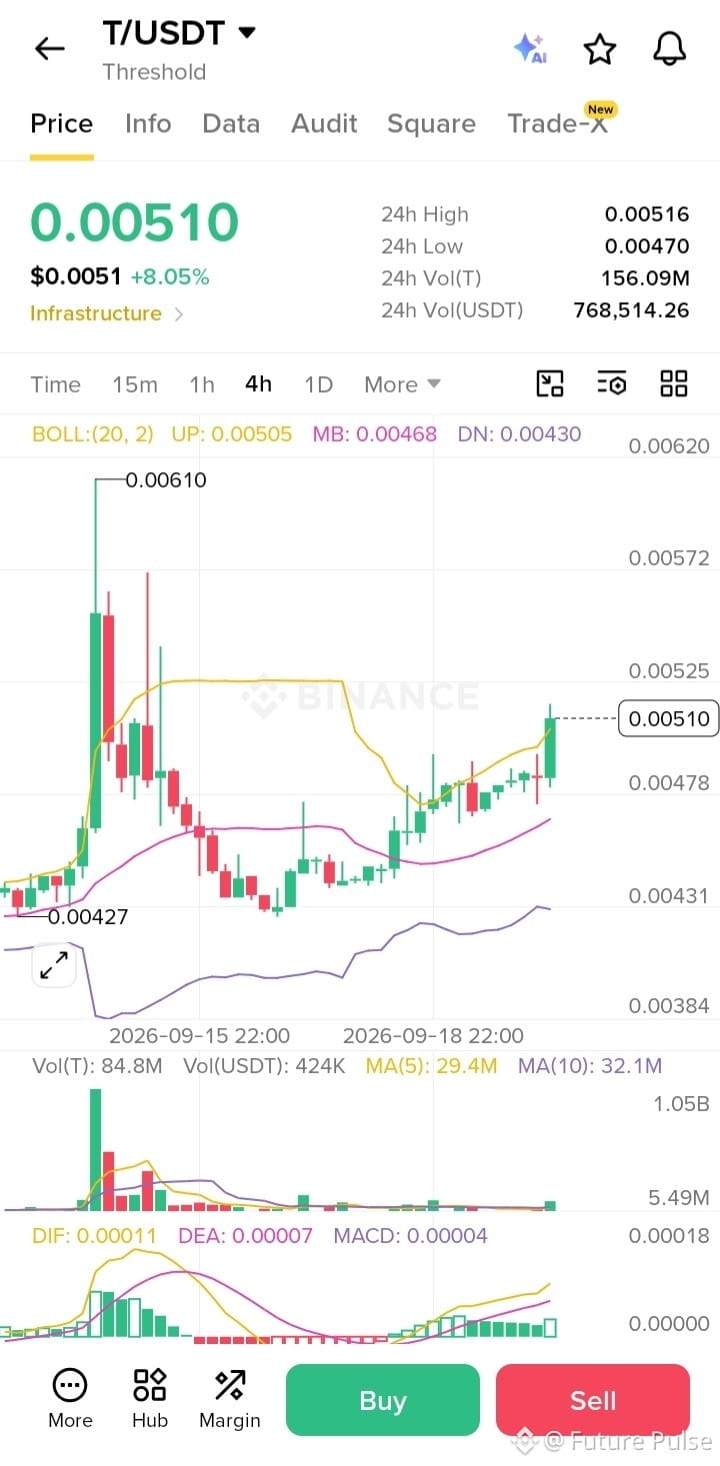

T is showing strong bullish momentum after breaking above the 0.00490–0.00500 zone. On the 1H chart, price is trading above the upper Bollinger Band with a major volume spike, while MACD has turned strongly positive. The 4H structure also supports the recovery, with price above the mid-band.
Key resistance: 0.00516, then 0.00525–0.00570.
Support: 0.00500, followed by 0.00485–0.00472.
A sustained hold above 0.00500 could keep momentum strong, while rejection may trigger a pullback toward support.
$LAB
$AKE
$T
Key resistance: 0.00516, then 0.00525–0.00570.
Support: 0.00500, followed by 0.00485–0.00472.
A sustained hold above 0.00500 could keep momentum strong, while rejection may trigger a pullback toward support.
$LAB
$AKE
$T