🧨 XTZ IS FINALLY SHOWING A STRUCTURAL REACTION
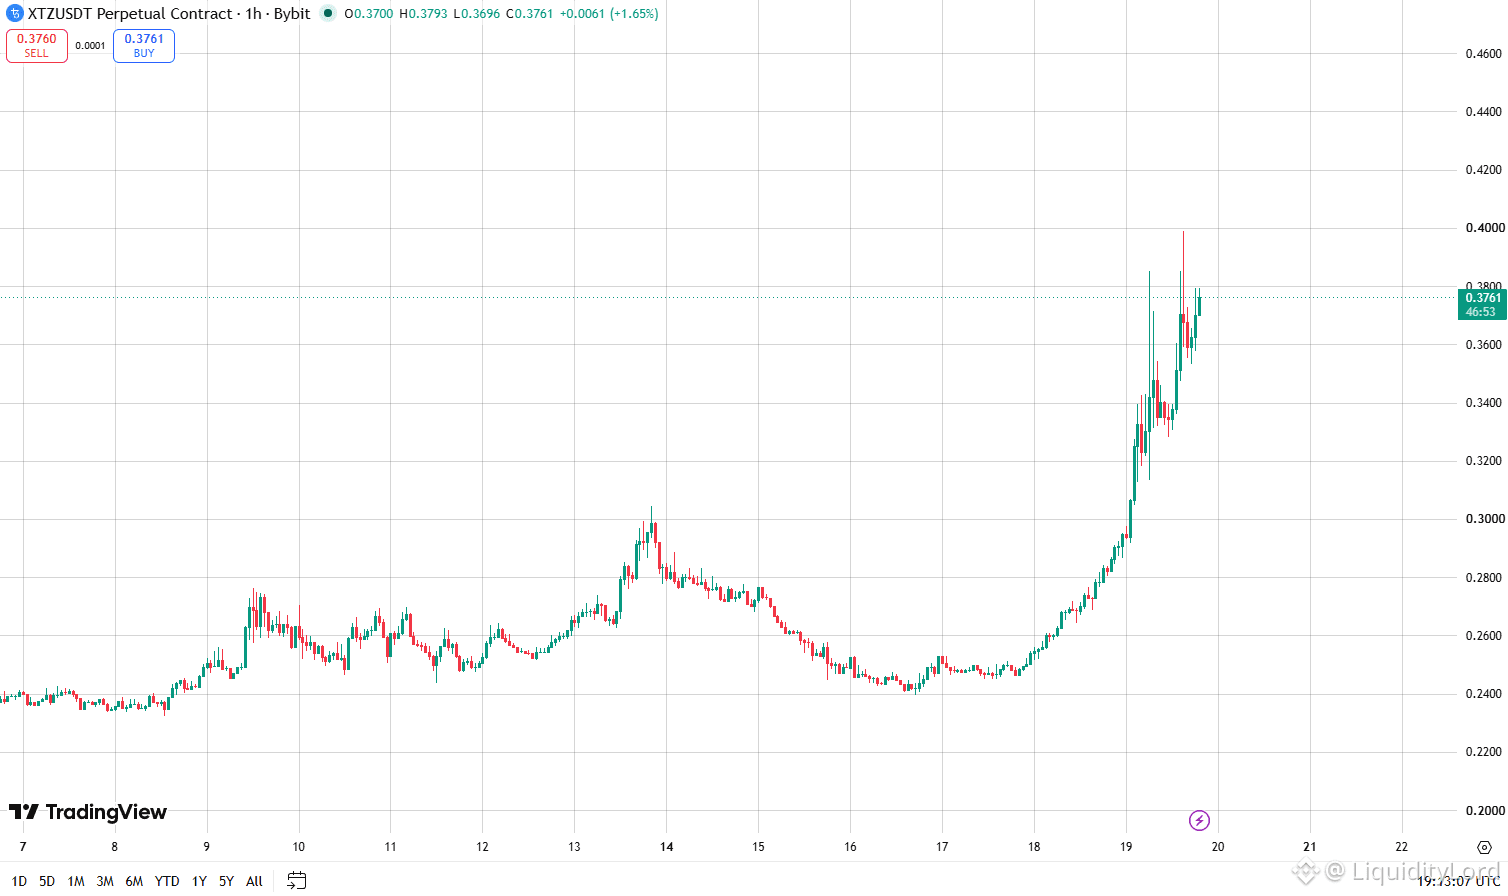
XTZ/USDT on the 1H chart is around 0.376 after a rapid advance from the 0.24–0.26 base. Price broke through 0.30 and accelerated toward 0.39, but the latest candles are now pressing against the top of the impulse. This is where continuation needs to prove itself.
🪜 THE CLIMB
The chart built a broad base before momentum expanded. Once 0.28 gave way, price began printing higher highs and higher lows, with the strongest acceleration appearing above 0.30. Price remains close to the highs, but distance from support has expanded.
Rather than treating 0.376 as an automatic entry, I would watch the first meaningful pullback.
🧭 A CLEANER ROADMAP
0.350–0.365 → preferred reaction area
0.335 → structure invalidation
0.390 → first objective
0.420 → second objective
0.460 → extension
The setup becomes more interesting if price revisits 0.350–0.365 and forms a higher low. Below 0.335, the current hourly sequence weakens. A reclaim above 0.390 would put 0.420 and then 0.460 into focus.
📊 MOMENTUM NEEDS A BASE
The key detail is the speed of the latest leg. Fast advances can continue, but they also create a larger distance between price and previous support. The cleaner confirmation would therefore be consolidation near the highs rather than another vertical candle.
A sideways hold above 0.35 would show that sellers are struggling to unwind the impulse. A deeper return through 0.335 would put the breakout under pressure.
🧩 THE OTHER ANGLE
Omniston brings a separate DeFi perspective through RFQ-based execution, where competing resolvers can source quotes for cross-chain swaps. I treat that as infrastructure context, not as a directional signal for XTZ.
For this chart, the question is simple: can momentum turn into a stable higher-low structure? If yes, the upside map remains open. If not, the pullback deepens.
NFA - DYOR
$XTZ
XTZ/USDT on the 1H chart is around 0.376 after a rapid advance from the 0.24–0.26 base. Price broke through 0.30 and accelerated toward 0.39, but the latest candles are now pressing against the top of the impulse. This is where continuation needs to prove itself.
🪜 THE CLIMB
The chart built a broad base before momentum expanded. Once 0.28 gave way, price began printing higher highs and higher lows, with the strongest acceleration appearing above 0.30. Price remains close to the highs, but distance from support has expanded.
Rather than treating 0.376 as an automatic entry, I would watch the first meaningful pullback.
🧭 A CLEANER ROADMAP
0.350–0.365 → preferred reaction area
0.335 → structure invalidation
0.390 → first objective
0.420 → second objective
0.460 → extension
The setup becomes more interesting if price revisits 0.350–0.365 and forms a higher low. Below 0.335, the current hourly sequence weakens. A reclaim above 0.390 would put 0.420 and then 0.460 into focus.
📊 MOMENTUM NEEDS A BASE
The key detail is the speed of the latest leg. Fast advances can continue, but they also create a larger distance between price and previous support. The cleaner confirmation would therefore be consolidation near the highs rather than another vertical candle.
A sideways hold above 0.35 would show that sellers are struggling to unwind the impulse. A deeper return through 0.335 would put the breakout under pressure.
🧩 THE OTHER ANGLE
Omniston brings a separate DeFi perspective through RFQ-based execution, where competing resolvers can source quotes for cross-chain swaps. I treat that as infrastructure context, not as a directional signal for XTZ.
For this chart, the question is simple: can momentum turn into a stable higher-low structure? If yes, the upside map remains open. If not, the pullback deepens.
NFA - DYOR
$XTZ