🧭 SUI IS TESTING THE FLOOR OF A LONG DECLINE
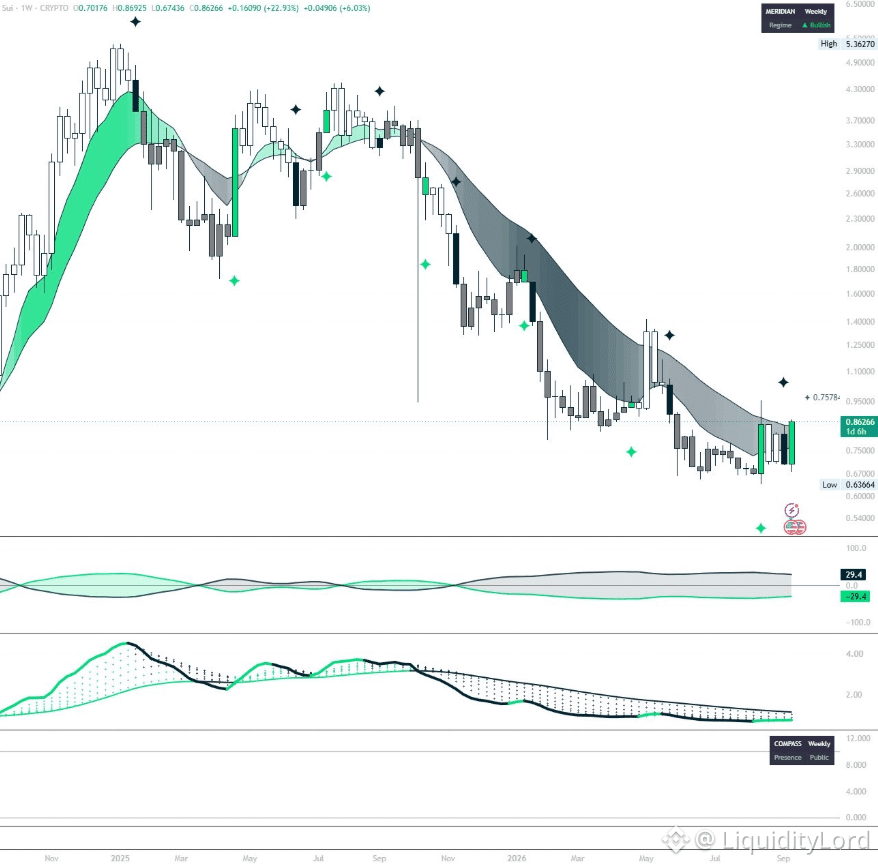
SUI/USDT on the weekly chart is near 0.863 after recovering from the marked 0.6366 low. The bigger picture remains dominated by the descending ribbon that has controlled price since the 2025 highs, but the latest candles show a different behavior: sellers printed a fresh low, yet buyers reclaimed part of the range.
🔬 THE STRUCTURE IS SHIFTING
Price spent months declining before compressing around 0.65–0.80. It has now pushed back above 0.80, while the lower momentum panels are no longer falling with the same force. That does not confirm a reversal, but it creates a clear inflection zone.
A sustained move above the recent base would bring the descending ribbon into focus. Failure to hold the recovery would keep the broader bearish structure intact.
📐 THE LEVEL MAP
0.78–0.86 → reaction zone
0.6366 → structural invalidation
1.00 → first objective
1.30 → second objective
1.80 → major upside test
I would not treat 0.86 as a breakout alone. The cleaner setup is a weekly higher low above the base, followed by acceptance through the descending ribbon. Losing 0.78 weakens the recovery thesis; losing 0.6366 removes its structural foundation.
🧩 WHY THE RIBBON MATTERS
The shaded trend structure has repeatedly acted as dynamic resistance during the decline. Price is approaching it from below, making this the next major test. A reclaim would improve the weekly structure; another rejection would show that sellers still control the larger trend.
⚙ THE DEFI FOOTNOTE
ST0Nfi represents a separate DeFi infrastructure angle around decentralized liquidity and execution. I keep that context independent from the SUI chart: fundamentals can add context, but they do not replace price confirmation.
The key point: 0.6366 produced a reaction, but the weekly trend still needs to prove that this is more than a relief bounce.
NFA - DYOR
$SUI
SUI/USDT on the weekly chart is near 0.863 after recovering from the marked 0.6366 low. The bigger picture remains dominated by the descending ribbon that has controlled price since the 2025 highs, but the latest candles show a different behavior: sellers printed a fresh low, yet buyers reclaimed part of the range.
🔬 THE STRUCTURE IS SHIFTING
Price spent months declining before compressing around 0.65–0.80. It has now pushed back above 0.80, while the lower momentum panels are no longer falling with the same force. That does not confirm a reversal, but it creates a clear inflection zone.
A sustained move above the recent base would bring the descending ribbon into focus. Failure to hold the recovery would keep the broader bearish structure intact.
📐 THE LEVEL MAP
0.78–0.86 → reaction zone
0.6366 → structural invalidation
1.00 → first objective
1.30 → second objective
1.80 → major upside test
I would not treat 0.86 as a breakout alone. The cleaner setup is a weekly higher low above the base, followed by acceptance through the descending ribbon. Losing 0.78 weakens the recovery thesis; losing 0.6366 removes its structural foundation.
🧩 WHY THE RIBBON MATTERS
The shaded trend structure has repeatedly acted as dynamic resistance during the decline. Price is approaching it from below, making this the next major test. A reclaim would improve the weekly structure; another rejection would show that sellers still control the larger trend.
⚙ THE DEFI FOOTNOTE
ST0Nfi represents a separate DeFi infrastructure angle around decentralized liquidity and execution. I keep that context independent from the SUI chart: fundamentals can add context, but they do not replace price confirmation.
The key point: 0.6366 produced a reaction, but the weekly trend still needs to prove that this is more than a relief bounce.
NFA - DYOR
$SUI