INJ: IS THE $50 MOVE BACK ON?
I’m not looking at $INJ the same way anymore.
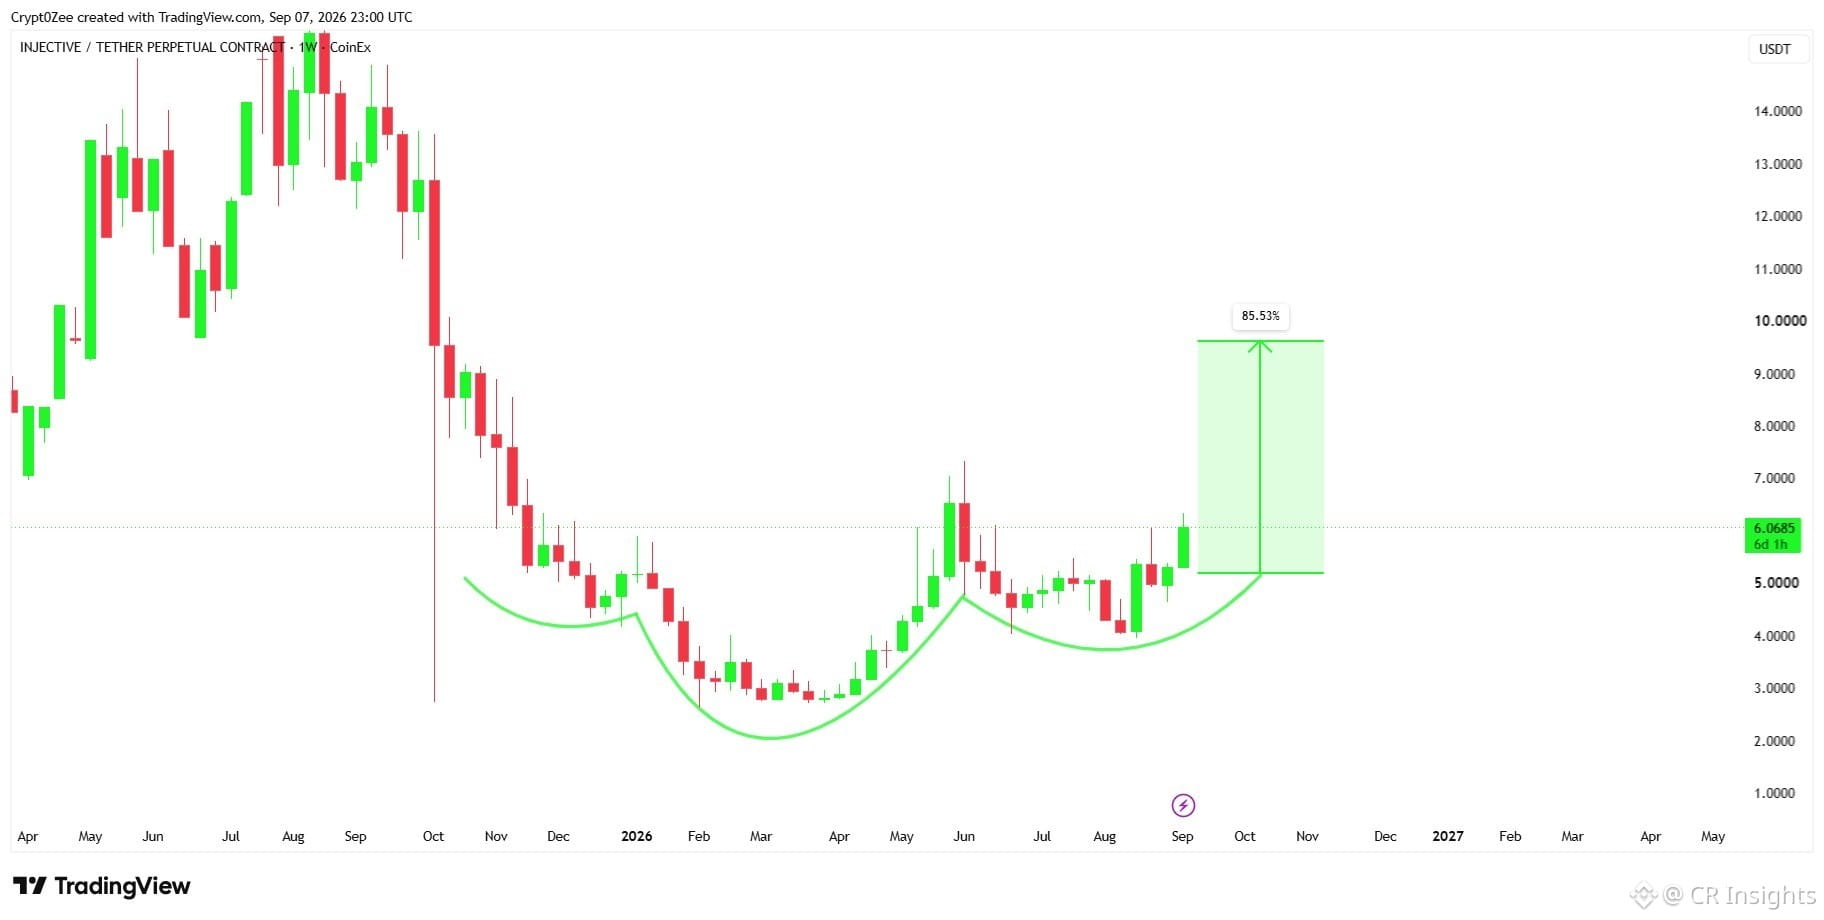
This weekly chart is showing something that’s hard to ignore.
Left shoulder → deep head around $3 → right shoulder → neckline around $5.
That’s an inverse head & shoulders — a bullish reversal structure that forms when sellers lose control at the lows and buyers gradually take over.
And now? INJ has broken above the neckline.
The interesting part is the measured move.
In a textbook inverse H&S, traders often measure the distance from the head to the neckline and project it upward from the breakout. That’s roughly where this chart gets the $9.5 area.
But I’m looking beyond $9.5. We’ve already seen INJ show serious momentum once:
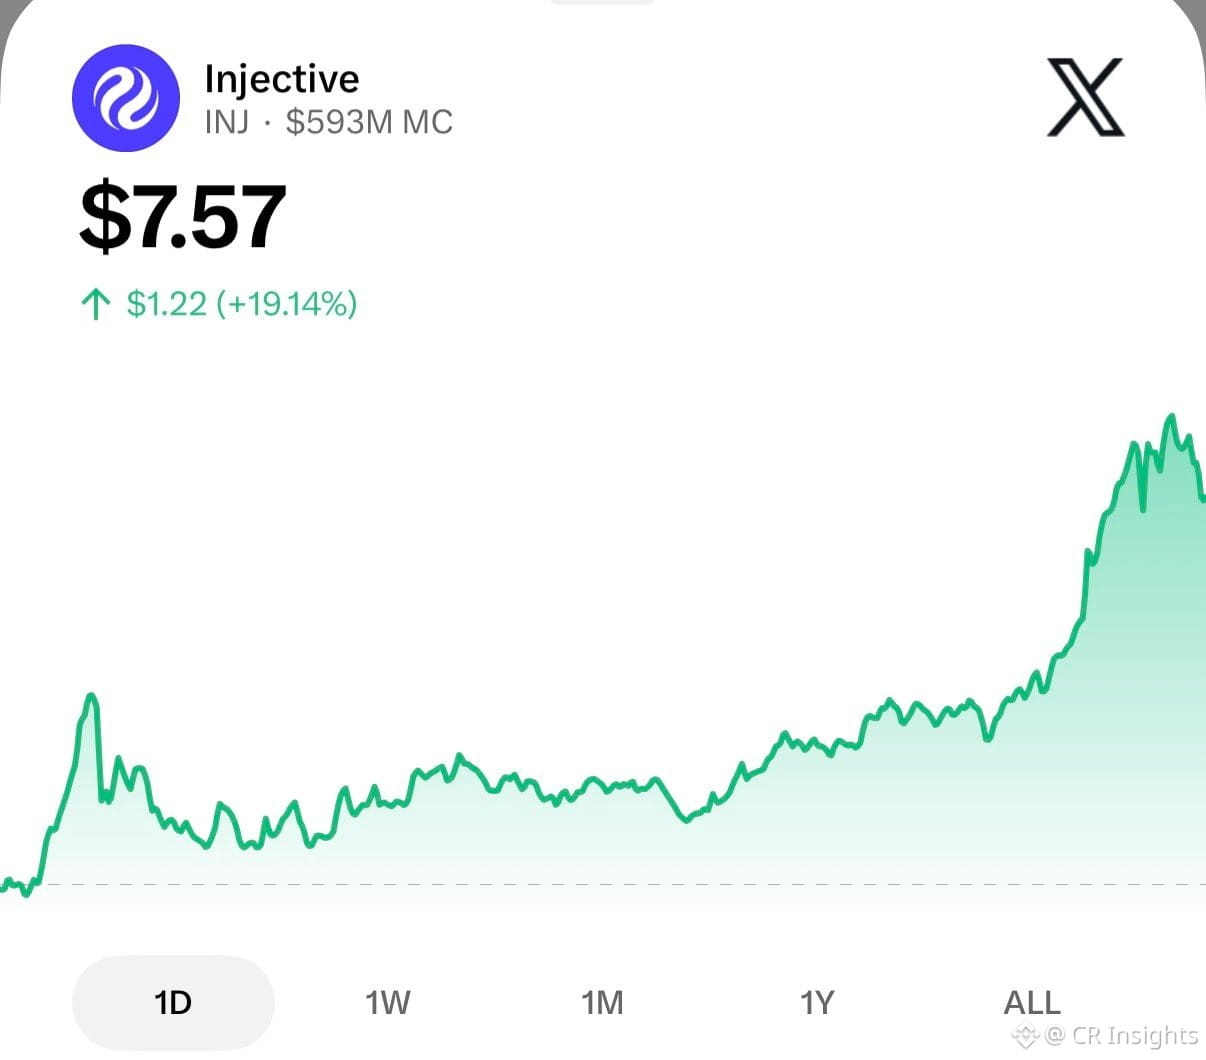
$3 → $7.
If this breakout develops into another sustained expansion, the conversation can quickly change from: “Can INJ reach $10?”
to “Can INJ make another run toward $20, $30… even $50?”
I’m not calling $50 guaranteed. From ~$6, that would require a huge expansion in price, liquidity and market value.
But look at what has changed:
Months of accumulation. Inverse H&S structure. Neckline breakout. Momentum returning.
The setup is there.
Now the important part is confirmation. If INJ can hold above the old neckline instead of immediately falling back into the pattern, the breakout becomes much more convincing.
$9.5 is the first major test.
$50 is the bigger question.
And honestly, this is where the $INJ chart gets interesting.
I’m not looking at $INJ the same way anymore.
This weekly chart is showing something that’s hard to ignore.
Left shoulder → deep head around $3 → right shoulder → neckline around $5.
That’s an inverse head & shoulders — a bullish reversal structure that forms when sellers lose control at the lows and buyers gradually take over.
And now? INJ has broken above the neckline.
The interesting part is the measured move.
In a textbook inverse H&S, traders often measure the distance from the head to the neckline and project it upward from the breakout. That’s roughly where this chart gets the $9.5 area.
But I’m looking beyond $9.5. We’ve already seen INJ show serious momentum once:
$3 → $7.
If this breakout develops into another sustained expansion, the conversation can quickly change from: “Can INJ reach $10?”
to “Can INJ make another run toward $20, $30… even $50?”
I’m not calling $50 guaranteed. From ~$6, that would require a huge expansion in price, liquidity and market value.
But look at what has changed:
Months of accumulation. Inverse H&S structure. Neckline breakout. Momentum returning.
The setup is there.
Now the important part is confirmation. If INJ can hold above the old neckline instead of immediately falling back into the pattern, the breakout becomes much more convincing.
$9.5 is the first major test.
$50 is the bigger question.
And honestly, this is where the $INJ chart gets interesting.