AKE is making a serious move, and the chart is starting to tell a bullish story.
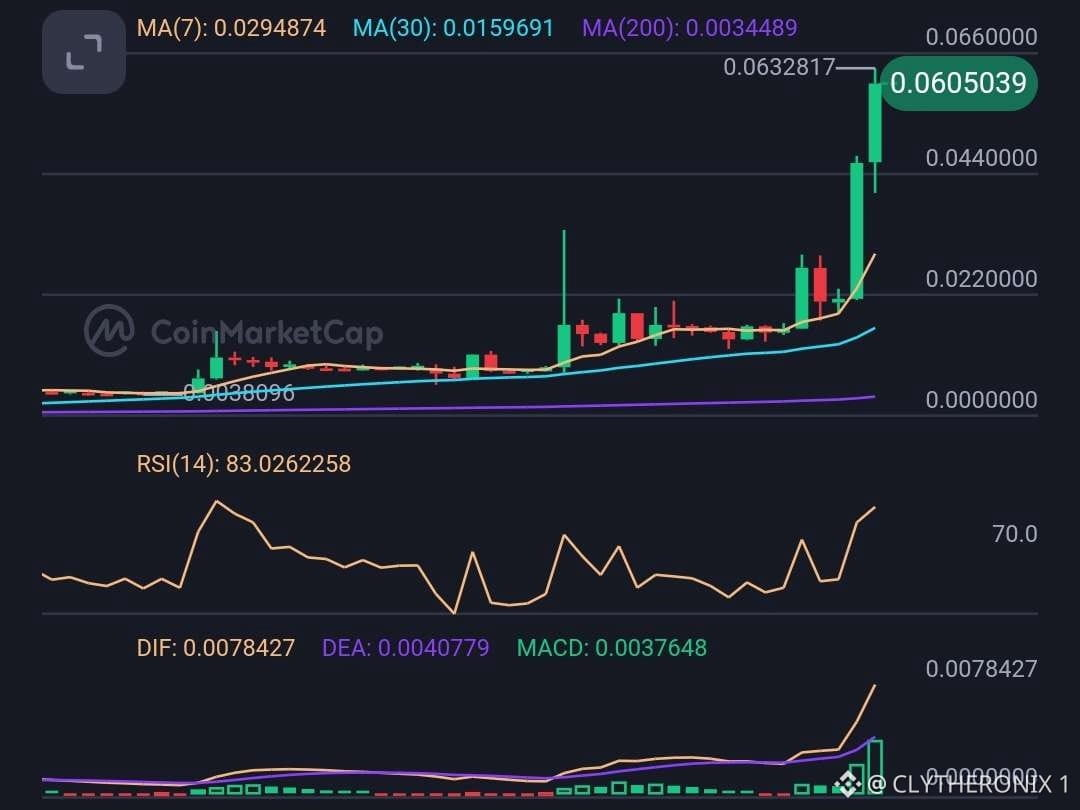
$AKE is trading around $0.0605 after a strong breakout, with price now sitting far above the 7 day, 30-day, and 200-day moving averages. The 7 day MA is around $0.0295, while the 30-day sits near $0.0160. That gap shows how quickly momentum has picked up.
RSI is at 83, so the move is overheated in the short term, and a pullback would not be surprising. But MACD is strongly positive and expanding, showing strong buying momentum.
Market activity is also impressive. $AKE/ $USDT pairs are showing more than $100M in combined 24-hour volume across leading markets.
If AKE holds above $0.044 and breaks the $0.0633 high. The bullish momentum could continue.
$AKE is trading around $0.0605 after a strong breakout, with price now sitting far above the 7 day, 30-day, and 200-day moving averages. The 7 day MA is around $0.0295, while the 30-day sits near $0.0160. That gap shows how quickly momentum has picked up.
RSI is at 83, so the move is overheated in the short term, and a pullback would not be surprising. But MACD is strongly positive and expanding, showing strong buying momentum.
Market activity is also impressive. $AKE/ $USDT pairs are showing more than $100M in combined 24-hour volume across leading markets.
If AKE holds above $0.044 and breaks the $0.0633 high. The bullish momentum could continue.