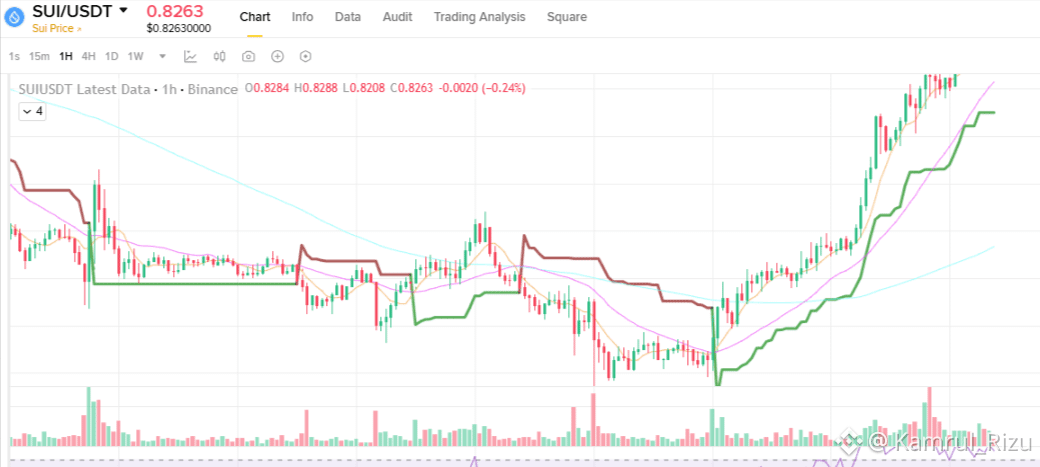
How to Identify your buying signal: Look #SUI🔥 Trading chart for example:
1. Price reaches support ✅
2. Bullish candle appears ✅
3. Volume increases ✅
4. RSI starts recovering ✅
5. Next candle continues upward ✅
Now you have a much stronger bullish signal.
1. Price reaches support ✅
2. Bullish candle appears ✅
3. Volume increases ✅
4. RSI starts recovering ✅
5. Next candle continues upward ✅
Now you have a much stronger bullish signal.