$ZAMA building momentum after reclaiming key moving averages 🚀
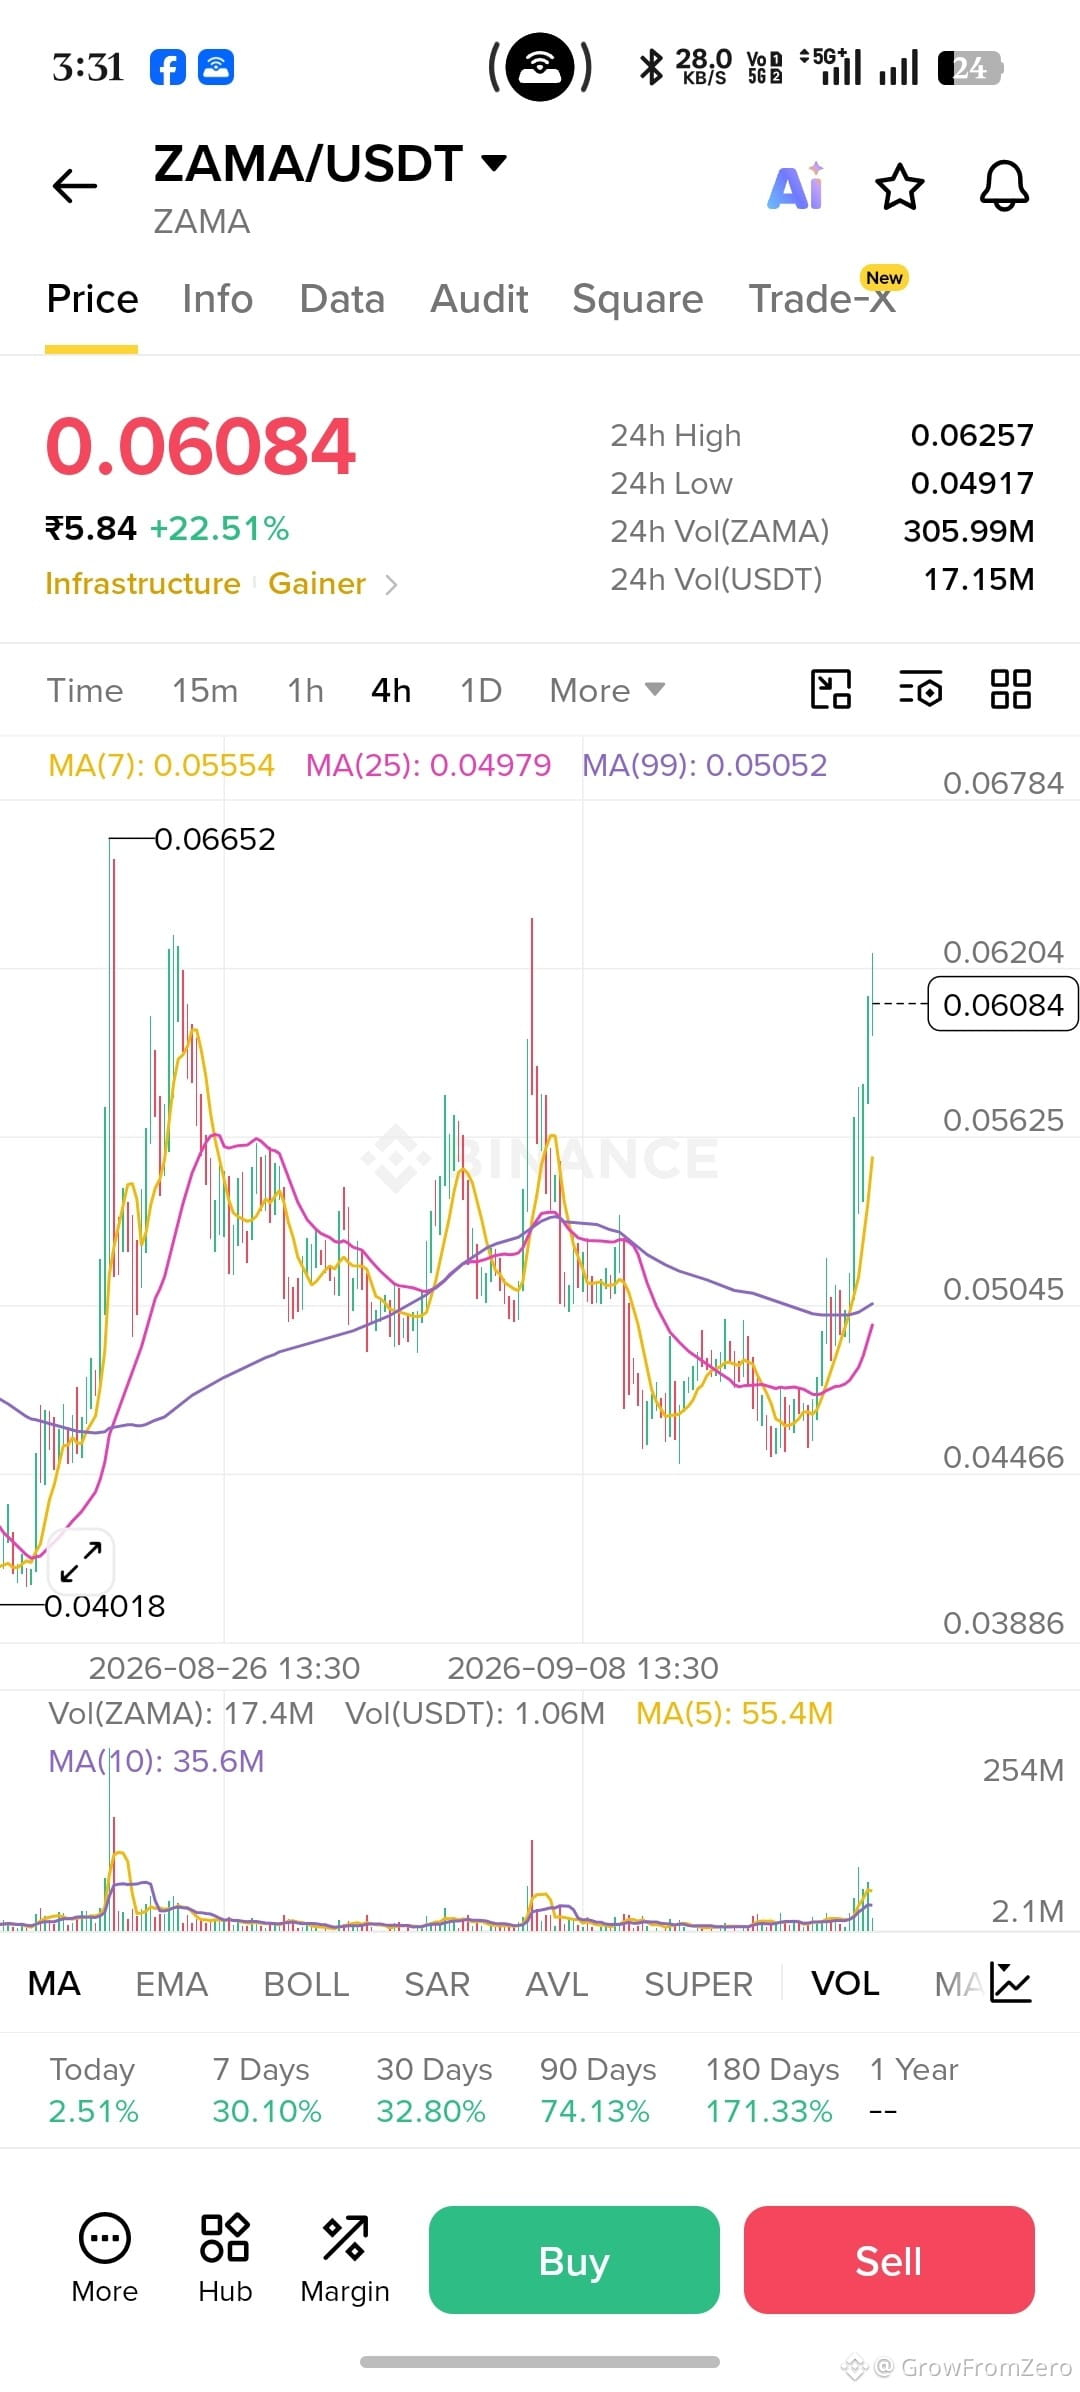
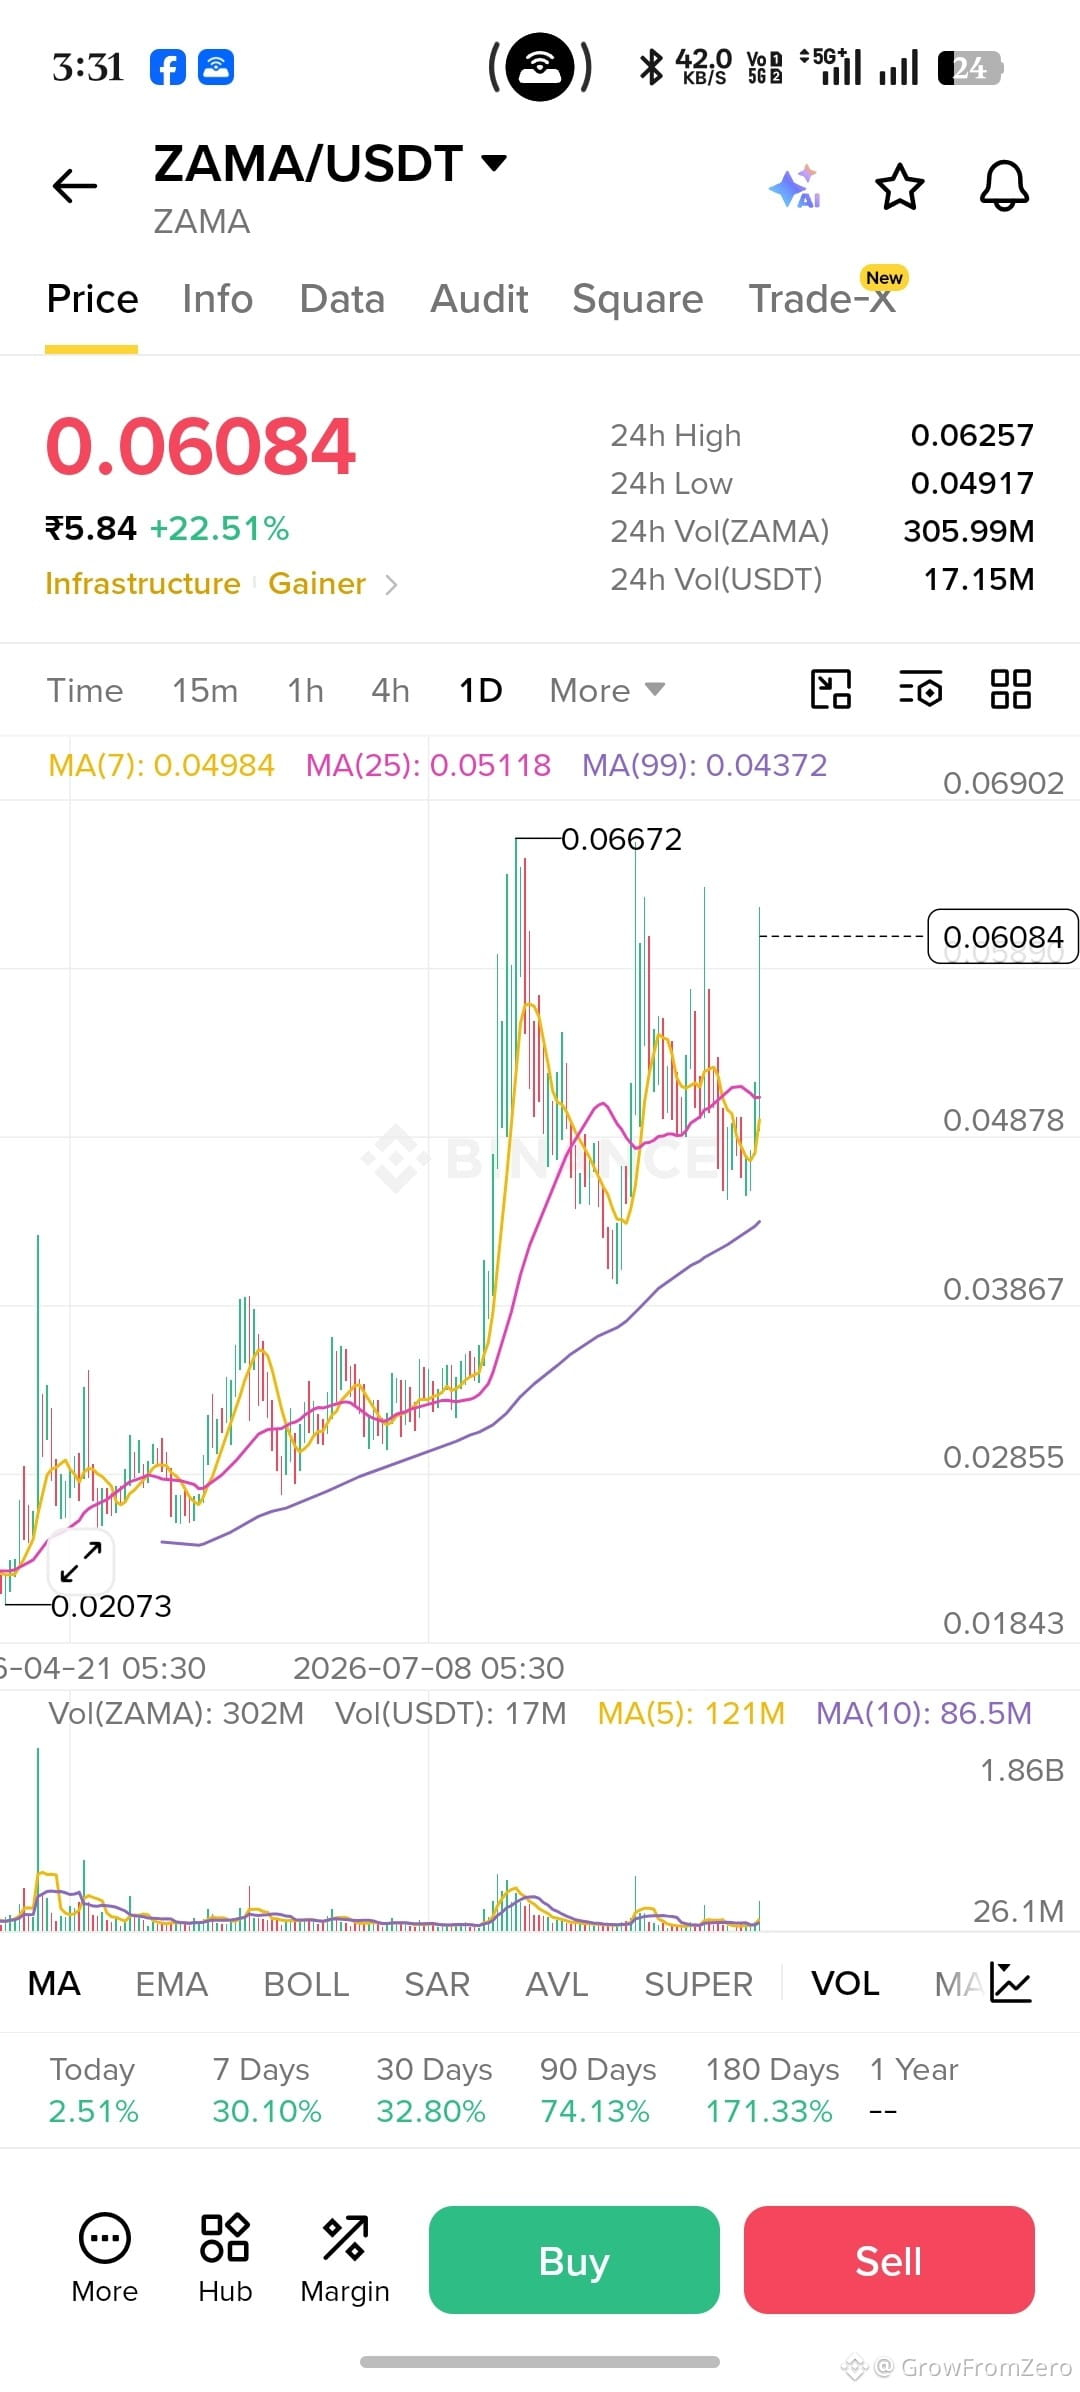
$ZAMA is showing a healthy recovery on both the 4H and Daily charts, trading around $0.06084 after gaining more than 22% in the last 24 hours. The latest rally is supported by expanding volume and a strong push above the 25 & 99 MA, signaling renewed bullish interest.
Rather than a single spike, the structure suggests buyers are attempting to establish a higher trading range above $0.058.
Price Map
Support: $0.0560
Resistance 1: $0.0625
Resistance 2: $0.0667
If momentum continues, the recent swing high near $0.0667 becomes the next major level to watch.
$ZAMA is showing a healthy recovery on both the 4H and Daily charts, trading around $0.06084 after gaining more than 22% in the last 24 hours. The latest rally is supported by expanding volume and a strong push above the 25 & 99 MA, signaling renewed bullish interest.
Rather than a single spike, the structure suggests buyers are attempting to establish a higher trading range above $0.058.
Price Map
Support: $0.0560
Resistance 1: $0.0625
Resistance 2: $0.0667
If momentum continues, the recent swing high near $0.0667 becomes the next major level to watch.