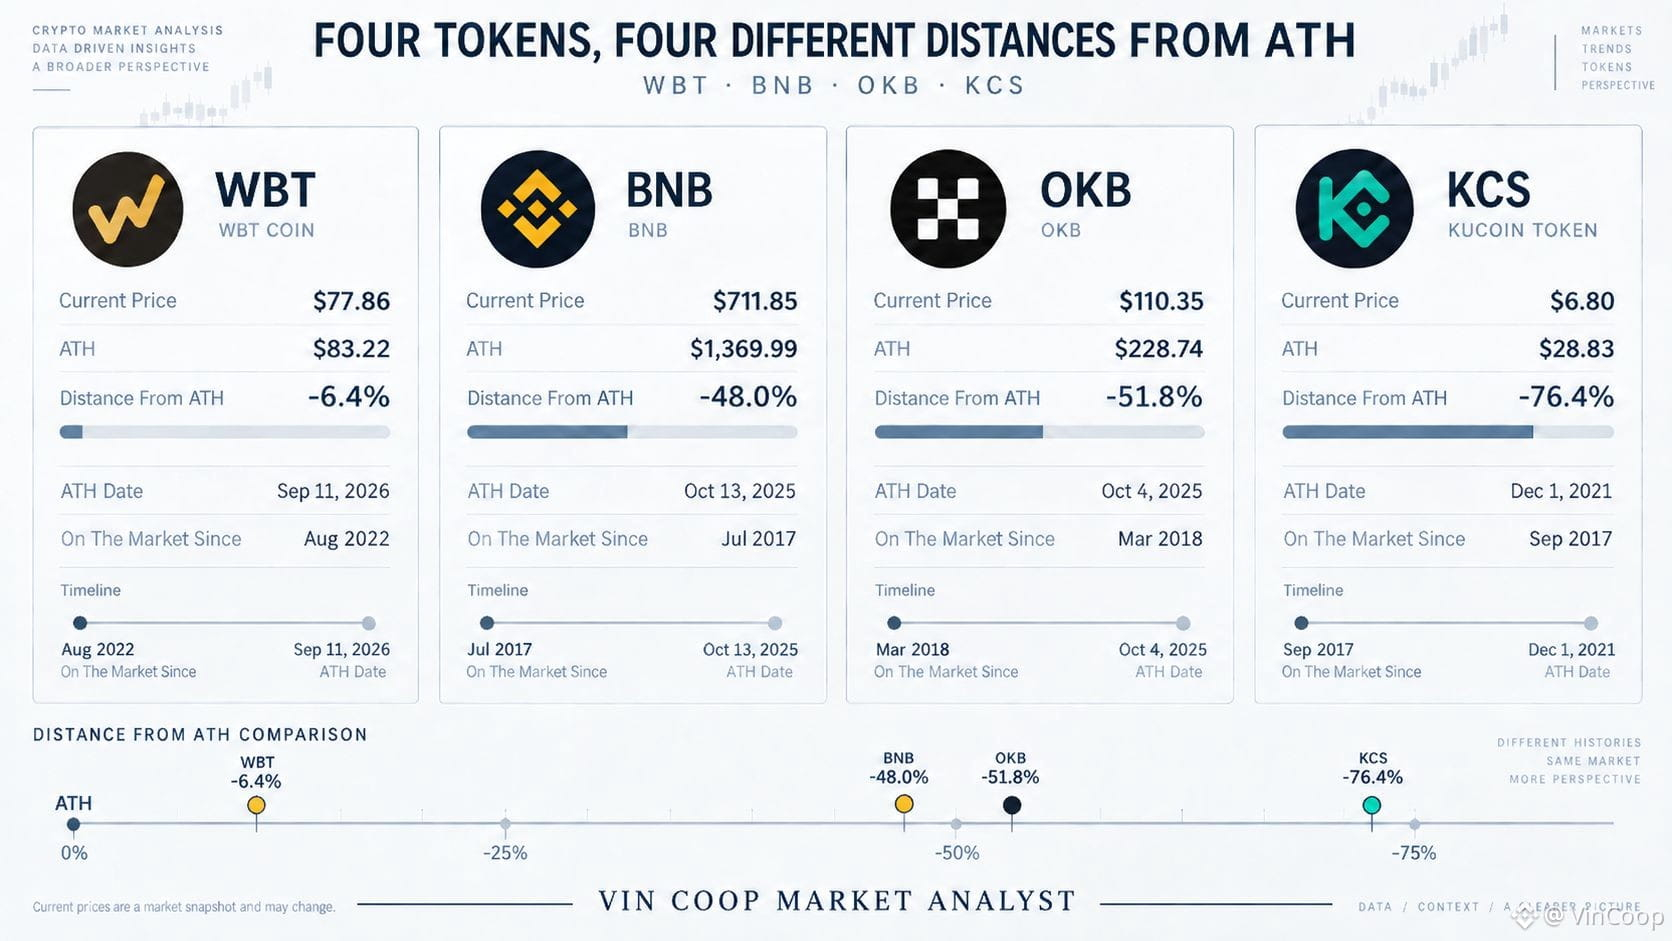
📊 How Far Are WBT, BNB, OKB and KCS From Their Peaks? When $BTC moves closer to or further from its all-time high, the distance from that peak naturally becomes part of the market discussion. I wanted to apply the same measure to four coins with exchange roots - $WBT , $BNB , $OKB and $KCS - while also looking at how long each has been on the market. At the time of writing, CoinGecko shows: 🟡 WBT - around $77.86 ATH: $83.22 Distance from ATH: -6.4% ATH date: September 11, 2026 On the market since: August 2022 🔵 BNB - around $711.85 ATH: $1,369.99 Distance from ATH: -48.0% ATH date: October 13, 2025 On the market since: July 2017 🟢 OKB - around $110.35 ATH: $228.74 Distance from ATH: -51.8% ATH date: October 4, 2025 On the market since: March 2018 🟣 KCS - around $6.80 ATH: $28.83 Distance from ATH: -76.4% ATH date: December 1, 2021 On the market since: September 2017 The dates make the comparison more interesting. BNB and KCS have been on the market since 2017, OKB since 2018, while WBT entered in 2022. Their historical peaks were also set in different periods: KCS is still measured against a 2021 high, BNB and OKB against peaks from 2025, and WBT against a high recorded in 2026. So the percentage below ATH is useful as a snapshot, but not as a ranking. Each number compares a coin with its own price history, formed over a different period and across different market cycles. 🤔 When looking at a coin, do you pay more attention to its distance from ATH or to when that ATH was set? Source: CoinGecko for current price and ATH data; official project sources for market history. Current prices are a snapshot and may change. Disclaimer: This is not financial or investment advice. Do your own research before making any decisions. #BTC Price Analysis# #Altcoin Season# #Ad #Crypto

Veröffentlichen

--
Haftungsausschluss: Enthält Meinungen von Drittanbietern. Keine Beratung. Binance AI wird ohne Gewähr bereitgestellt. Siehe AGB.