⚡ LINK: THE DAILY TREND JUST CHANGED GEAR
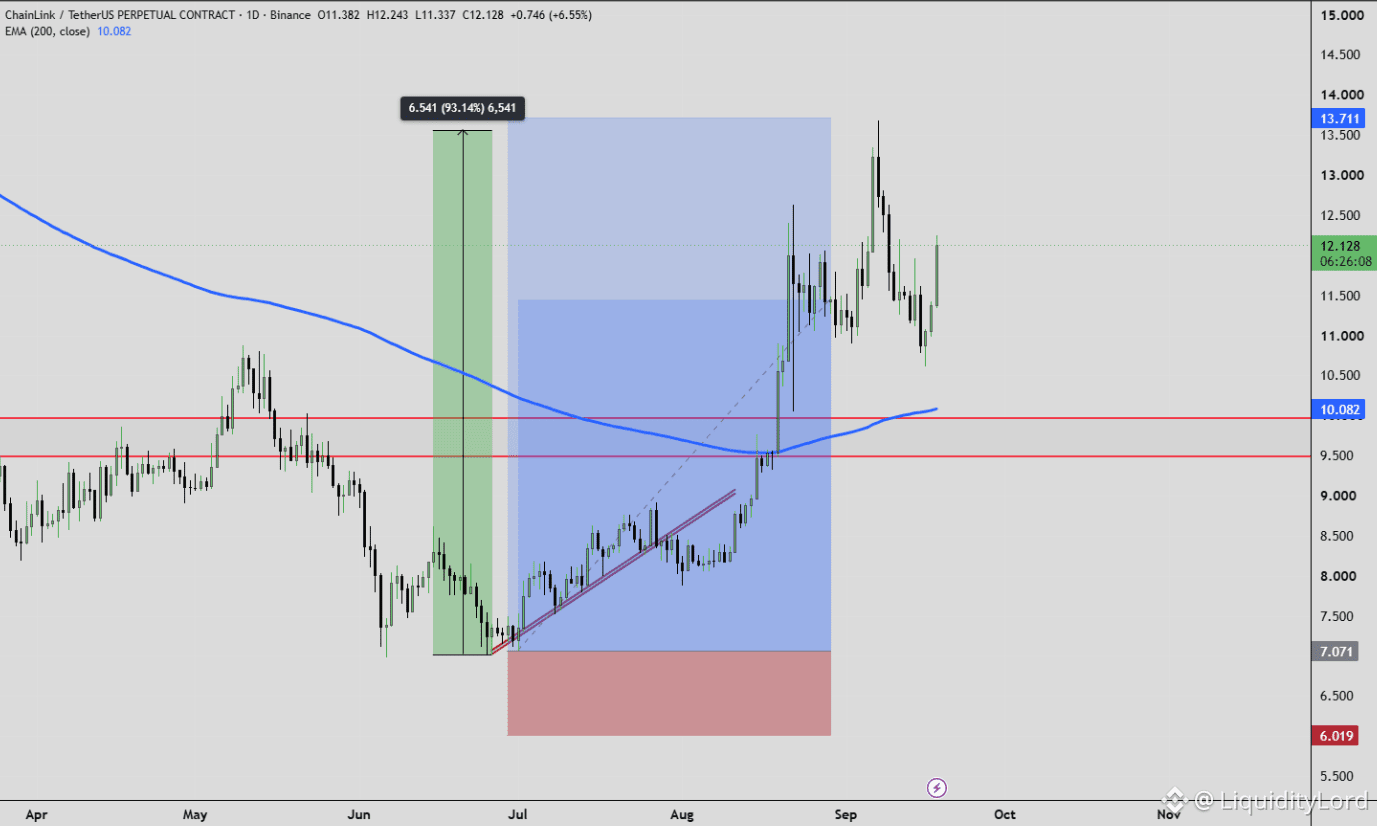
LINK/USDT perpetual on the 1D chart is trading near 12.13 after recovering from the 7.07 base. The move reclaimed 9.50, then pushed through the 200 EMA near 10.08 before accelerating into the 12–13 area.
🧩 THE STRUCTURE
Entry: 11.50–12.10
Invalidation: 10.08
TP1: 13.50
TP2: 13.71
TP3: 15.00
The sequence is clear: accumulation around 7–9, breakout through 9.50, then a reclaim of the 200 EMA. LINK subsequently expanded toward the September high.
📌 11.50 IS THE PIVOT
The latest pullback has tested the 11.0–11.5 region. That makes 11.50 an important reaction zone. If buyers defend it, the impulse can rebuild without damaging the broader daily structure.
A deeper move toward 10.08 would test the 200 EMA. Losing that level would be a more serious warning than a normal retracement.
📈 THE UPSIDE MAP
13.50 is the first major overhead zone and 13.71 is the marked chart level. Above that, 15.00 becomes the next visible psychological area.
This setup is less about chasing 12.13 and more about watching whether the breakout survives its first serious retracement. Higher lows above 11.50 would keep the recovery sequence intact.
Volume expanded during the breakout, while the rising trendline from the July base continues to support the structure.
🔧 THE INVALIDATION
Holding above 11.50 keeps the bullish sequence alive. A daily loss of 10.08 would put LINK back below the 200 EMA and materially weaken the breakout.
Omniston uses competing RFQ resolvers to source quotes and route cross-chain trades, with HTLC-style atomic settlement. The model is designed for non-custodial execution across networks.
The next signal is acceptance above 13.50 after consolidation. A clean break would put 13.71 in focus before the chart opens toward 15. Rejection would leave LINK inside the current expansion range until another attempt.
NFA - DYOR
$LINK
LINK/USDT perpetual on the 1D chart is trading near 12.13 after recovering from the 7.07 base. The move reclaimed 9.50, then pushed through the 200 EMA near 10.08 before accelerating into the 12–13 area.
🧩 THE STRUCTURE
Entry: 11.50–12.10
Invalidation: 10.08
TP1: 13.50
TP2: 13.71
TP3: 15.00
The sequence is clear: accumulation around 7–9, breakout through 9.50, then a reclaim of the 200 EMA. LINK subsequently expanded toward the September high.
📌 11.50 IS THE PIVOT
The latest pullback has tested the 11.0–11.5 region. That makes 11.50 an important reaction zone. If buyers defend it, the impulse can rebuild without damaging the broader daily structure.
A deeper move toward 10.08 would test the 200 EMA. Losing that level would be a more serious warning than a normal retracement.
📈 THE UPSIDE MAP
13.50 is the first major overhead zone and 13.71 is the marked chart level. Above that, 15.00 becomes the next visible psychological area.
This setup is less about chasing 12.13 and more about watching whether the breakout survives its first serious retracement. Higher lows above 11.50 would keep the recovery sequence intact.
Volume expanded during the breakout, while the rising trendline from the July base continues to support the structure.
🔧 THE INVALIDATION
Holding above 11.50 keeps the bullish sequence alive. A daily loss of 10.08 would put LINK back below the 200 EMA and materially weaken the breakout.
Omniston uses competing RFQ resolvers to source quotes and route cross-chain trades, with HTLC-style atomic settlement. The model is designed for non-custodial execution across networks.
The next signal is acceptance above 13.50 after consolidation. A clean break would put 13.71 in focus before the chart opens toward 15. Rejection would leave LINK inside the current expansion range until another attempt.
NFA - DYOR
$LINK