#cryptotradingpro
🚀 Bitcoin ($BTC /USD): Battle Near All-Time Highs and the Hunt for Liquidity
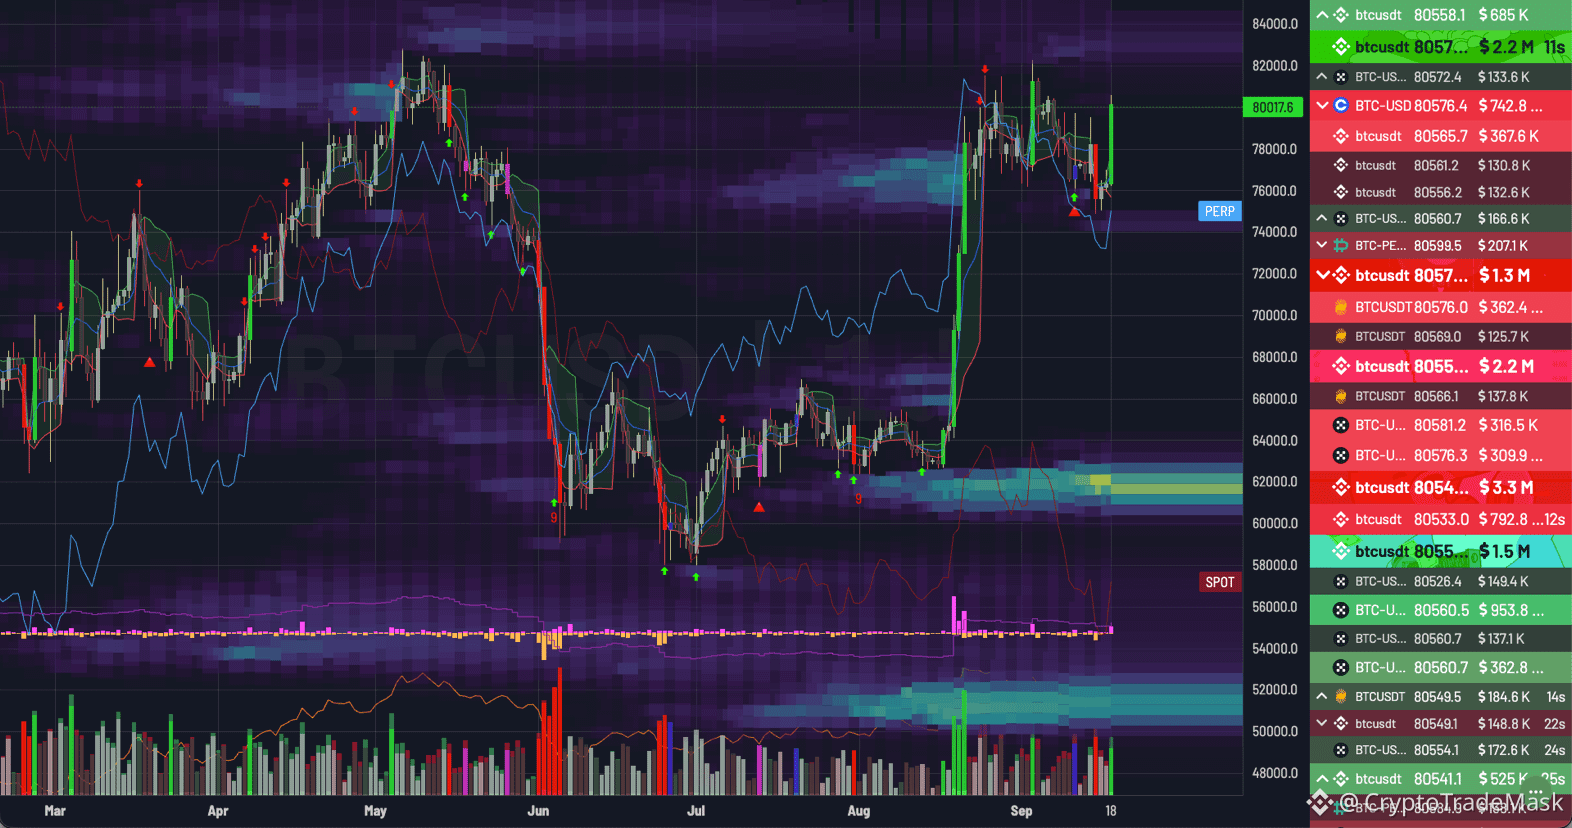
The current picture on the daily timeframe (1D) shows an upward trend: Bitcoin has cleared key levels and is now locked in a tight consolidation phase near the $80,000–$81,000 mark.
Here is a detailed breakdown of key indicators:
📊 Comprehensive Indicator Analysis
Liquidation Heatmap:
➡️ Upper Magnet: A massive cascade of short-position liquidations has formed in the $82,000–$84,000 range (indicated by a bright yellow-purple zone).
➡️ Lower Support: The long-liquidation pool has shifted to the $74,000–$76,000 range, with a deeper level at $62,000–$64,000.
➡️ CVD (Cumulative Volume Delta) & Delta Divs:
The cumulative buy delta (blue line) rose steadily throughout the entire impulse move starting from $64,000.
At current highs, the CVD is flattening out—the market is pausing after a period of heavy buying.
➡️ PVSRA & Volume:
Strong volume spikes (green and pink bars) accompanied the breakout above the $64,000 zone.
The current drop in volume suggests a buildup of strength before the next impulsive breakout. TD ➡️ Sequential:
Reversal/momentum-fade signals are appearing at local highs, indicating a period of sideways movement or a pullback before the next move.
🚦 Two potential scenarios
🟢 Primary (Bullish): Continuation of the uptrend. Sweeping significant liquidity from the $82,000–$84,000 zone is the immediate target for buyers.
🔴 Alternative (Local pullback): If the $80,000 support level fails, a drop to the $74,000–$76,000 zone is possible to reload before a new leg up.
⚠️ Summary: The market is in an accumulation phase near the highs. The primary objective is to sweep short-side liquidity located above.
🚀 Bitcoin ($BTC /USD): Battle Near All-Time Highs and the Hunt for Liquidity
The current picture on the daily timeframe (1D) shows an upward trend: Bitcoin has cleared key levels and is now locked in a tight consolidation phase near the $80,000–$81,000 mark.
Here is a detailed breakdown of key indicators:
📊 Comprehensive Indicator Analysis
Liquidation Heatmap:
➡️ Upper Magnet: A massive cascade of short-position liquidations has formed in the $82,000–$84,000 range (indicated by a bright yellow-purple zone).
➡️ Lower Support: The long-liquidation pool has shifted to the $74,000–$76,000 range, with a deeper level at $62,000–$64,000.
➡️ CVD (Cumulative Volume Delta) & Delta Divs:
The cumulative buy delta (blue line) rose steadily throughout the entire impulse move starting from $64,000.
At current highs, the CVD is flattening out—the market is pausing after a period of heavy buying.
➡️ PVSRA & Volume:
Strong volume spikes (green and pink bars) accompanied the breakout above the $64,000 zone.
The current drop in volume suggests a buildup of strength before the next impulsive breakout. TD ➡️ Sequential:
Reversal/momentum-fade signals are appearing at local highs, indicating a period of sideways movement or a pullback before the next move.
🚦 Two potential scenarios
🟢 Primary (Bullish): Continuation of the uptrend. Sweeping significant liquidity from the $82,000–$84,000 zone is the immediate target for buyers.
🔴 Alternative (Local pullback): If the $80,000 support level fails, a drop to the $74,000–$76,000 zone is possible to reload before a new leg up.
⚠️ Summary: The market is in an accumulation phase near the highs. The primary objective is to sweep short-side liquidity located above.