🚨 $G
/USDT — Massive Breakout, But Volatility Is High
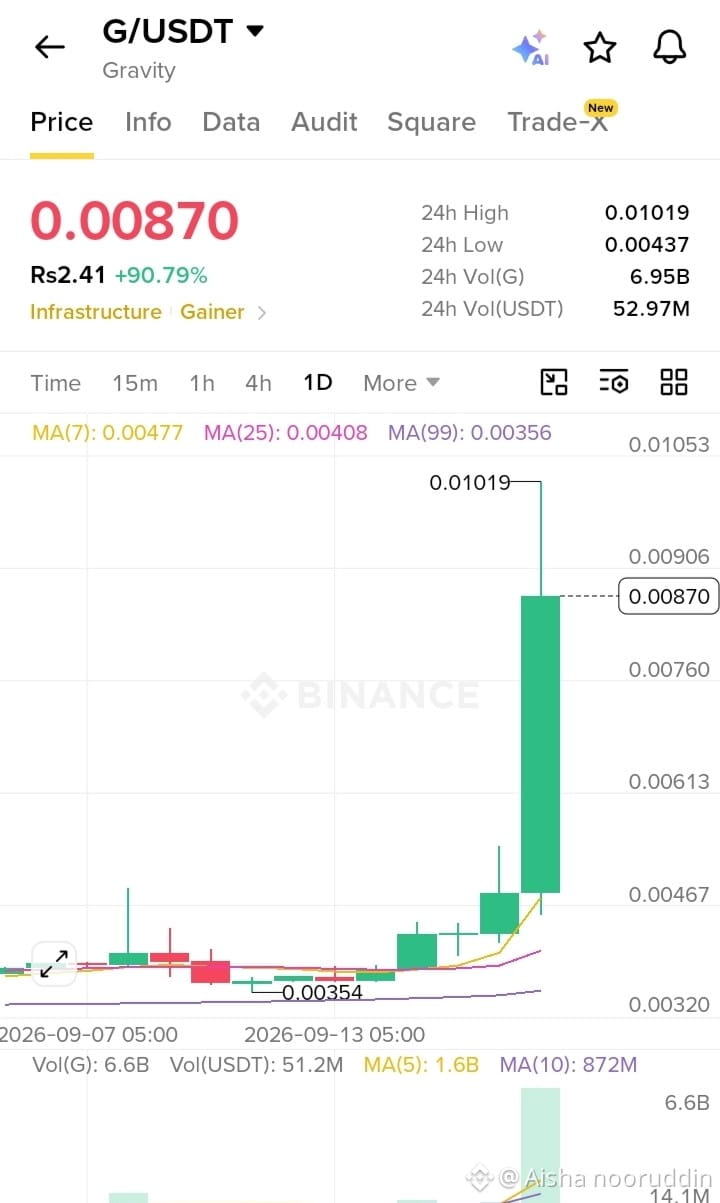
★ $G (Gravity) is showing a very strong breakout ★ on the 1D chart.
★ Current: 0.00870
★ 24H High: 0.01019
★ 24H Change: +90.79%
★ 24H Volume: ~$52.97M
★ What the chart shows:
Price has moved sharply above the MA(7), MA(25), and MA(99).
Volume has expanded significantly, confirming strong market activity.
0.01019 is the immediate resistance/high to watch.
Around 0.00760–0.00906 may become an important area to observe if price consolidates.
A deeper pullback could bring attention back toward the 0.00467 area.
⚠️ After such a large one-day move, volatility and pullbacks can be significant. I’d watch how price behaves around the recent high rather than assuming the move will continue.
Still watching. Still learning. 📊
What do you think — continuation or cooldown?
Not financial advice. This is my personal chart analysis and learning journey.
/USDT — Massive Breakout, But Volatility Is High
★ $G (Gravity) is showing a very strong breakout ★ on the 1D chart.
★ Current: 0.00870
★ 24H High: 0.01019
★ 24H Change: +90.79%
★ 24H Volume: ~$52.97M
★ What the chart shows:
Price has moved sharply above the MA(7), MA(25), and MA(99).
Volume has expanded significantly, confirming strong market activity.
0.01019 is the immediate resistance/high to watch.
Around 0.00760–0.00906 may become an important area to observe if price consolidates.
A deeper pullback could bring attention back toward the 0.00467 area.
⚠️ After such a large one-day move, volatility and pullbacks can be significant. I’d watch how price behaves around the recent high rather than assuming the move will continue.
Still watching. Still learning. 📊
What do you think — continuation or cooldown?
Not financial advice. This is my personal chart analysis and learning journey.