

$BTC has gained more than 6–7% over the past few hours, building strong bullish momentum and pushing back toward some of the most important resistance levels on the chart.
But after such a sharp move, Bitcoin is now entering a major technical resistance structure — while ETF flows remain inconsistent and regulatory uncertainty has not disappeared.
Can Bitcoin establish itself above $85,000, or is the current rally setting up another correction?
Macro Outlook
From a fundamental perspective, the bullish move still needs confirmation.
Bitcoin ETF flows have remained volatile rather than consistently bullish, suggesting that institutional demand has not yet developed into a stable one-way trend.
At the same time, the failure of the CLARITY Act to advance in the U.S. Senate has added another layer of regulatory uncertainty for the crypto market.
These factors do not necessarily end the rally, but they increase the importance of confirmation before assuming that a sustained bullish breakout has begun.
Technical Analysis
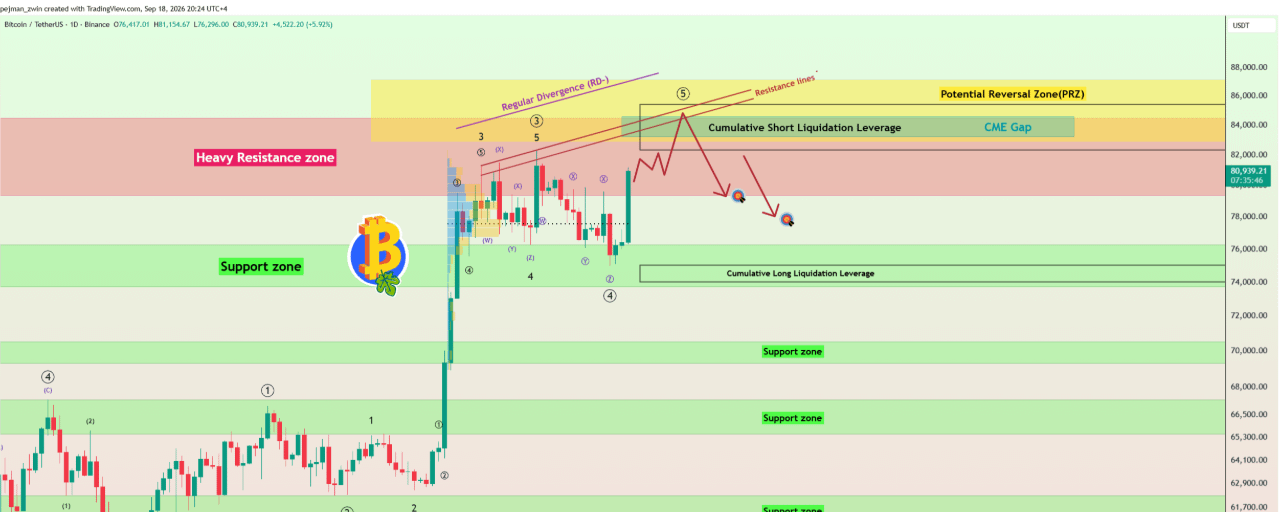
Bitcoin is currently trading inside the Heavy Resistance Zone at $79,350–$84,500, while approaching several major technical areas at the same time:
Potential Reversal Zone (PRZ): $82,850–$87,100
Cumulative Short Liquidation Leverage: $82,300–$85,400
Resistance Lines
The upper CME Gap at $83,215–$84,560 is also back in focus and could finally be filled after remaining open for several months.
From an Elliott Wave perspective, Bitcoin appears to be completing Primary Wave 5, while Primary Wave 3 developed as an Extended Wave.
A Negative Regular Divergence (RD-) is also visible between Consecutive Peaks, providing another warning that bullish momentum may be weakening as price moves deeper into resistance.
I expect Bitcoin to potentially move further into the Cumulative Short Liquidation Leverage and major PRZ, possibly filling the upper CME Gap first.
A temporary breakout above the Heavy Resistance Zone — followed by a Bull Trap — also remains possible before the next bearish move develops.
From this broader resistance structure, I expect Bitcoin to potentially correct toward $79,000.
If bearish momentum strengthens, the decline could extend toward the key $77,700 trading level.
Trade Setup
First TP: $79,000
Second TP: $77,700
Stop Loss: $87,300
Key Trading Level: $77,700
Upper CME Gap: $83,215–$84,560
Bitcoin’s momentum is clearly bullish right now — but price is also entering one of the strongest technical resistance clusters on the chart.
The next reaction inside $82,300–$87,100 could determine whether this rally develops into a genuine breakout or ends with another Bull Trap.
Which level will Bitcoin reach first?
🔴 $77,700
🟢 $87,300