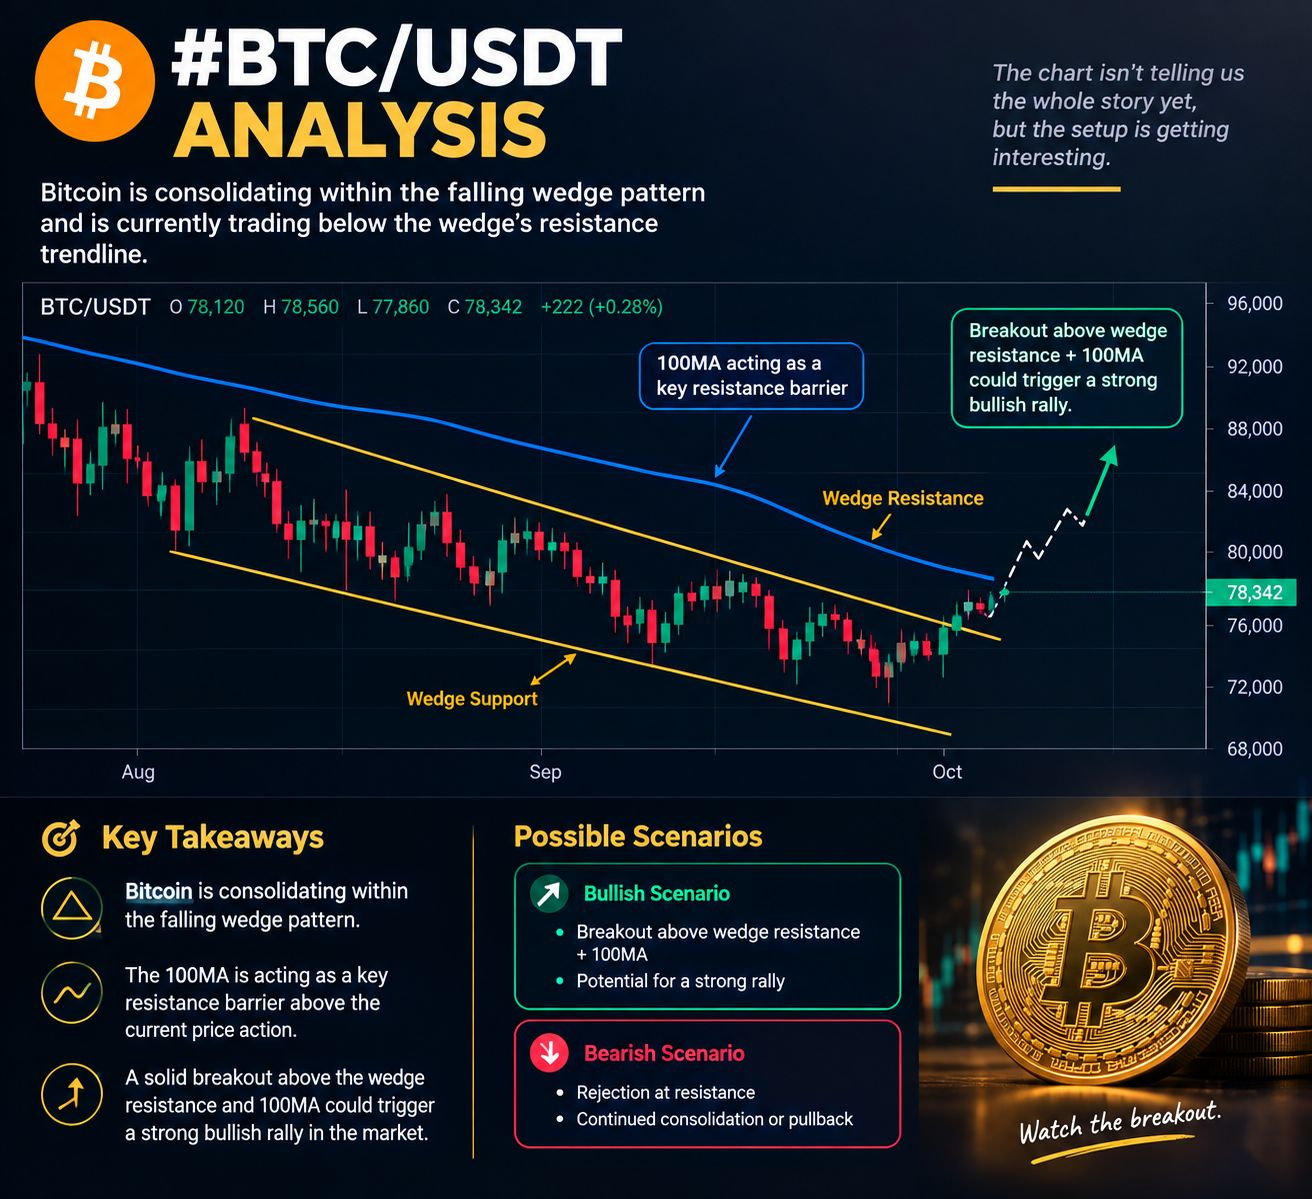

I’ve been watching BTC’s chart, and this looks more like a test than a confirmed breakout.
Bitcoin has recovered toward $78K, but the key question is whether buyers can turn the current resistance area into support.
Falling wedges can resolve sharply, but the pattern itself isn’t confirmation.
For me, the interesting part is what happens after the breakout attempt: does Bitcoin actually hold the level, or does the move fade?
That’s where the chart starts telling a more useful story.
$BTC
$BNB
#BTC
Bitcoin has recovered toward $78K, but the key question is whether buyers can turn the current resistance area into support.
Falling wedges can resolve sharply, but the pattern itself isn’t confirmation.
For me, the interesting part is what happens after the breakout attempt: does Bitcoin actually hold the level, or does the move fade?
That’s where the chart starts telling a more useful story.
$BTC
$BNB
#BTC