😏 SOL: THE DAILY BREAKOUT IS STARTING TO EXPAND
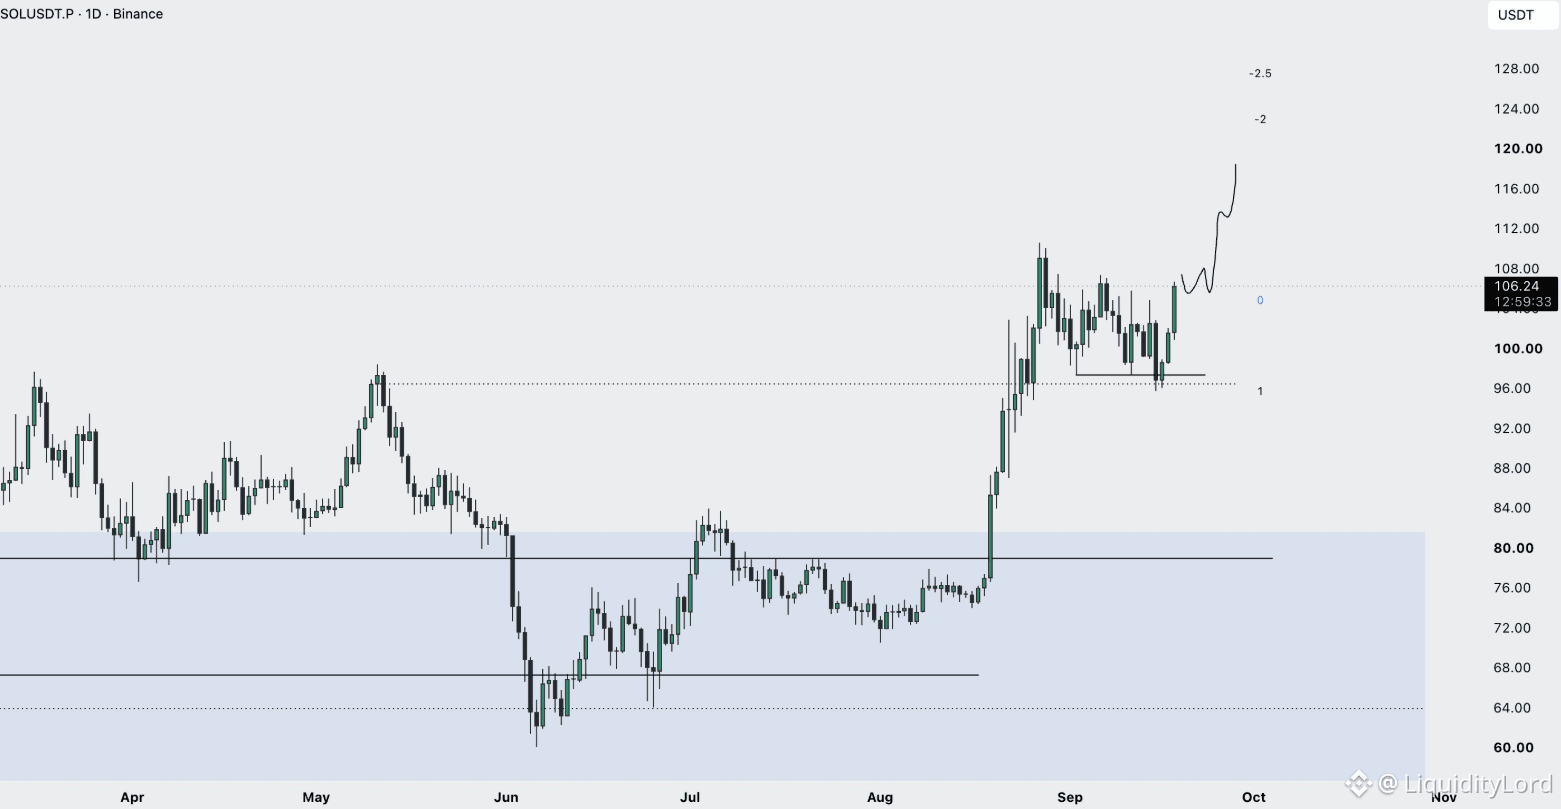
SOL/USDT.P on the 1D chart is pushing out of a multi-week compression after reclaiming the 96–98 zone. Price is now around 106, while the chart shows a higher-range structure with a projected path toward 118.
🎯 THE TRADE MAP
Entry: 103–107
Invalidation: 96
TP1: 112
TP2: 118
TP3: 124
The key shift came when SOL stopped treating 96 as resistance and began holding that area as support. Since then, price has built a compact range around 100–106 instead of immediately giving back the breakout.
⚡ WHY THIS LEVEL MATTERS
The 106–108 area is the decision zone. A close above it would strengthen continuation, while rejection could send price toward 100–102.
I would rather see SOL retest and hold than chase a vertical candle. If buyers defend 103–106, the structure stays constructive and expansion can target the higher levels shown.
📈 STRUCTURE CHECK
The recent candles are holding well above the old 96 boundary, which is the main structural change on this chart. A clean retest there would keep the breakout thesis intact while reducing the risk of buying directly into resistance.
🔥 THE PATH ABOVE
The first objective is 112, followed by the chart's projected extension near 118. A sustained break through that area would open room toward 124 on the broader price scale.
The bearish scenario is simple: failure above 106 followed by a daily loss of 96. That would weaken the breakout and return SOL to the previous range. Until then, the key question is whether the new upper range can turn into support.
💧 Omniston uses competing RFQ resolvers to source quotes and route cross-chain trades, with HTLC-style atomic settlement for execution across networks without a custodial bridge.
The sequence is breakout, retest, continuation. Confirmation remains critical.
NFA - DYOR
$SOL
SOL/USDT.P on the 1D chart is pushing out of a multi-week compression after reclaiming the 96–98 zone. Price is now around 106, while the chart shows a higher-range structure with a projected path toward 118.
🎯 THE TRADE MAP
Entry: 103–107
Invalidation: 96
TP1: 112
TP2: 118
TP3: 124
The key shift came when SOL stopped treating 96 as resistance and began holding that area as support. Since then, price has built a compact range around 100–106 instead of immediately giving back the breakout.
⚡ WHY THIS LEVEL MATTERS
The 106–108 area is the decision zone. A close above it would strengthen continuation, while rejection could send price toward 100–102.
I would rather see SOL retest and hold than chase a vertical candle. If buyers defend 103–106, the structure stays constructive and expansion can target the higher levels shown.
📈 STRUCTURE CHECK
The recent candles are holding well above the old 96 boundary, which is the main structural change on this chart. A clean retest there would keep the breakout thesis intact while reducing the risk of buying directly into resistance.
🔥 THE PATH ABOVE
The first objective is 112, followed by the chart's projected extension near 118. A sustained break through that area would open room toward 124 on the broader price scale.
The bearish scenario is simple: failure above 106 followed by a daily loss of 96. That would weaken the breakout and return SOL to the previous range. Until then, the key question is whether the new upper range can turn into support.
💧 Omniston uses competing RFQ resolvers to source quotes and route cross-chain trades, with HTLC-style atomic settlement for execution across networks without a custodial bridge.
The sequence is breakout, retest, continuation. Confirmation remains critical.
NFA - DYOR
$SOL