🚀 UNI: THE MULTI-YEAR BREAKOUT COULD BE JUST BEGINNING
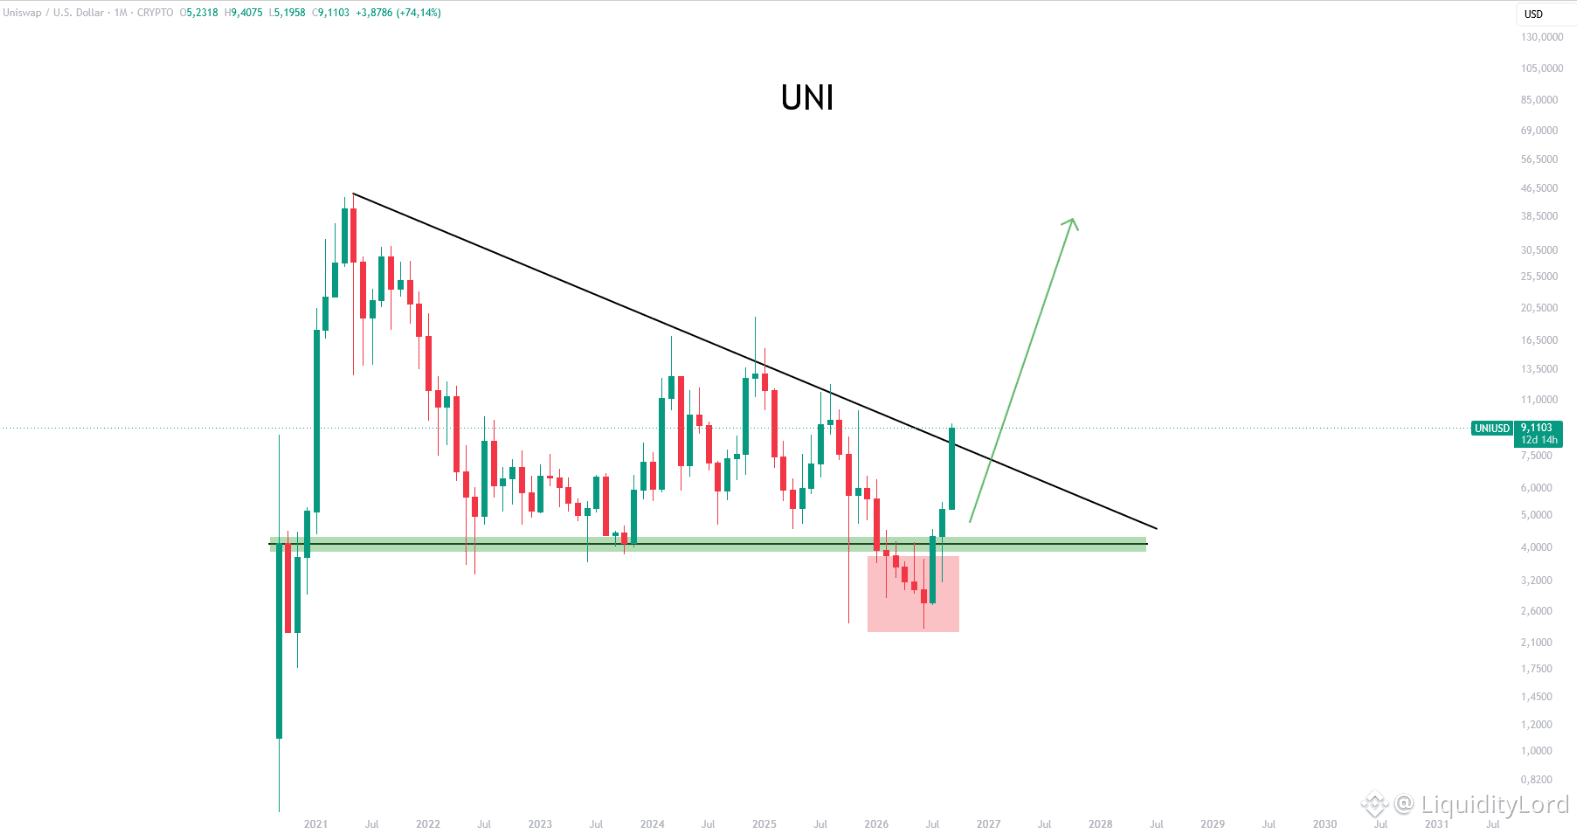
UNI/USD on the 1M chart is finally challenging the long descending resistance that has controlled price since the 2021 peak. The current candle is around 9.11 after a +74% monthly move, while the long-term 4.0 area has acted as a major base.
🎯 THE MACRO MAP
Entry: 7.50–9.20
Invalidation: 3.90
TP1: 13.50
TP2: 20.50
TP3: 38.50
UNI spent years printing lower highs beneath the falling trendline, while the 4.0 zone repeatedly attracted buyers. The latest impulse has now reclaimed that base and pushed directly into the descending resistance.
🔥 THIS IS THE LEVEL TO WATCH
A monthly close above the trendline would be the major confirmation. The cleaner continuation would then be a retest of the breakout area, with former resistance turning into support.
If that happens, the first expansion zone is around 13.5, followed by 20.5. The chart's long-term projection reaches roughly 38.5, but that remains a distant conditional target and requires several structural breaks first.
⚠ MACRO BREAKOUTS NEED CONFIRMATION
A rejection could send UNI back toward 7.5 or the 4.0 base. Losing 3.90 would invalidate the breakout thesis.
The distinction is breakout versus monthly acceptance. If price closes above the trendline and holds it on the next test, old resistance can become a launch zone. If the breakout fails, 7.5 becomes the first reaction zone before 4.0 is tested.
💧 EXECUTION HAS ITS OWN LAYER
Omniston adds a separate DeFi execution perspective through liquidity discovery and route comparison across fragmented markets. That execution layer is independent of UNI and does not determine this chart setup.
The upside path is conditional: 13.5 first, then 20.5, with 38.5 as the major long-term projection. Until the descending trendline becomes confirmed support, this remains a breakout attempt with volatility.
NFA - DYOR
$UNI
UNI/USD on the 1M chart is finally challenging the long descending resistance that has controlled price since the 2021 peak. The current candle is around 9.11 after a +74% monthly move, while the long-term 4.0 area has acted as a major base.
🎯 THE MACRO MAP
Entry: 7.50–9.20
Invalidation: 3.90
TP1: 13.50
TP2: 20.50
TP3: 38.50
UNI spent years printing lower highs beneath the falling trendline, while the 4.0 zone repeatedly attracted buyers. The latest impulse has now reclaimed that base and pushed directly into the descending resistance.
🔥 THIS IS THE LEVEL TO WATCH
A monthly close above the trendline would be the major confirmation. The cleaner continuation would then be a retest of the breakout area, with former resistance turning into support.
If that happens, the first expansion zone is around 13.5, followed by 20.5. The chart's long-term projection reaches roughly 38.5, but that remains a distant conditional target and requires several structural breaks first.
⚠ MACRO BREAKOUTS NEED CONFIRMATION
A rejection could send UNI back toward 7.5 or the 4.0 base. Losing 3.90 would invalidate the breakout thesis.
The distinction is breakout versus monthly acceptance. If price closes above the trendline and holds it on the next test, old resistance can become a launch zone. If the breakout fails, 7.5 becomes the first reaction zone before 4.0 is tested.
💧 EXECUTION HAS ITS OWN LAYER
Omniston adds a separate DeFi execution perspective through liquidity discovery and route comparison across fragmented markets. That execution layer is independent of UNI and does not determine this chart setup.
The upside path is conditional: 13.5 first, then 20.5, with 38.5 as the major long-term projection. Until the descending trendline becomes confirmed support, this remains a breakout attempt with volatility.
NFA - DYOR
$UNI