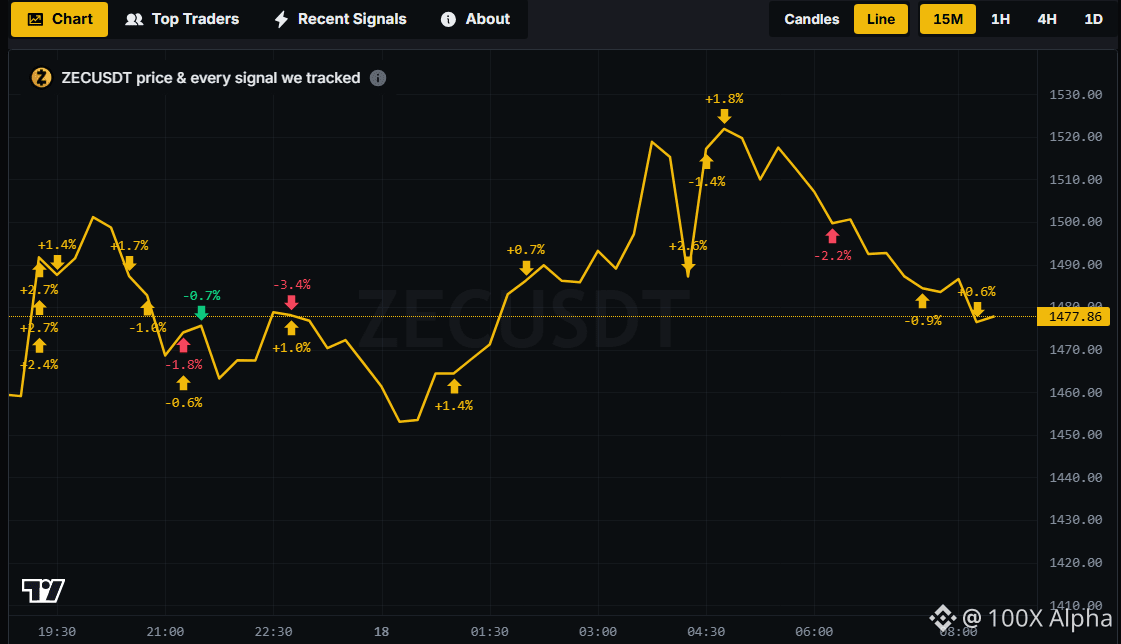
This $ZEC chart from SquareRadar AI is actually pretty interesting 👀
You can see every tracked signal sitting directly on the price action and how some worked for +1–2%, while others got stopped around -1% to -3%. Then ZEC pushed from the $1,490 area toward $1,520 before giving some of it back.
I like seeing the calls alongside the actual move. Makes it easier to see what happened after each signal instead of looking at the chart in isolation.
#squareradarAI
You can see every tracked signal sitting directly on the price action and how some worked for +1–2%, while others got stopped around -1% to -3%. Then ZEC pushed from the $1,490 area toward $1,520 before giving some of it back.
I like seeing the calls alongside the actual move. Makes it easier to see what happened after each signal instead of looking at the chart in isolation.
#squareradarAI