After so much decline, $REZ finally woke up last week... The big question on everyone's mind: "Is it a continuation, or just a fake pump?"
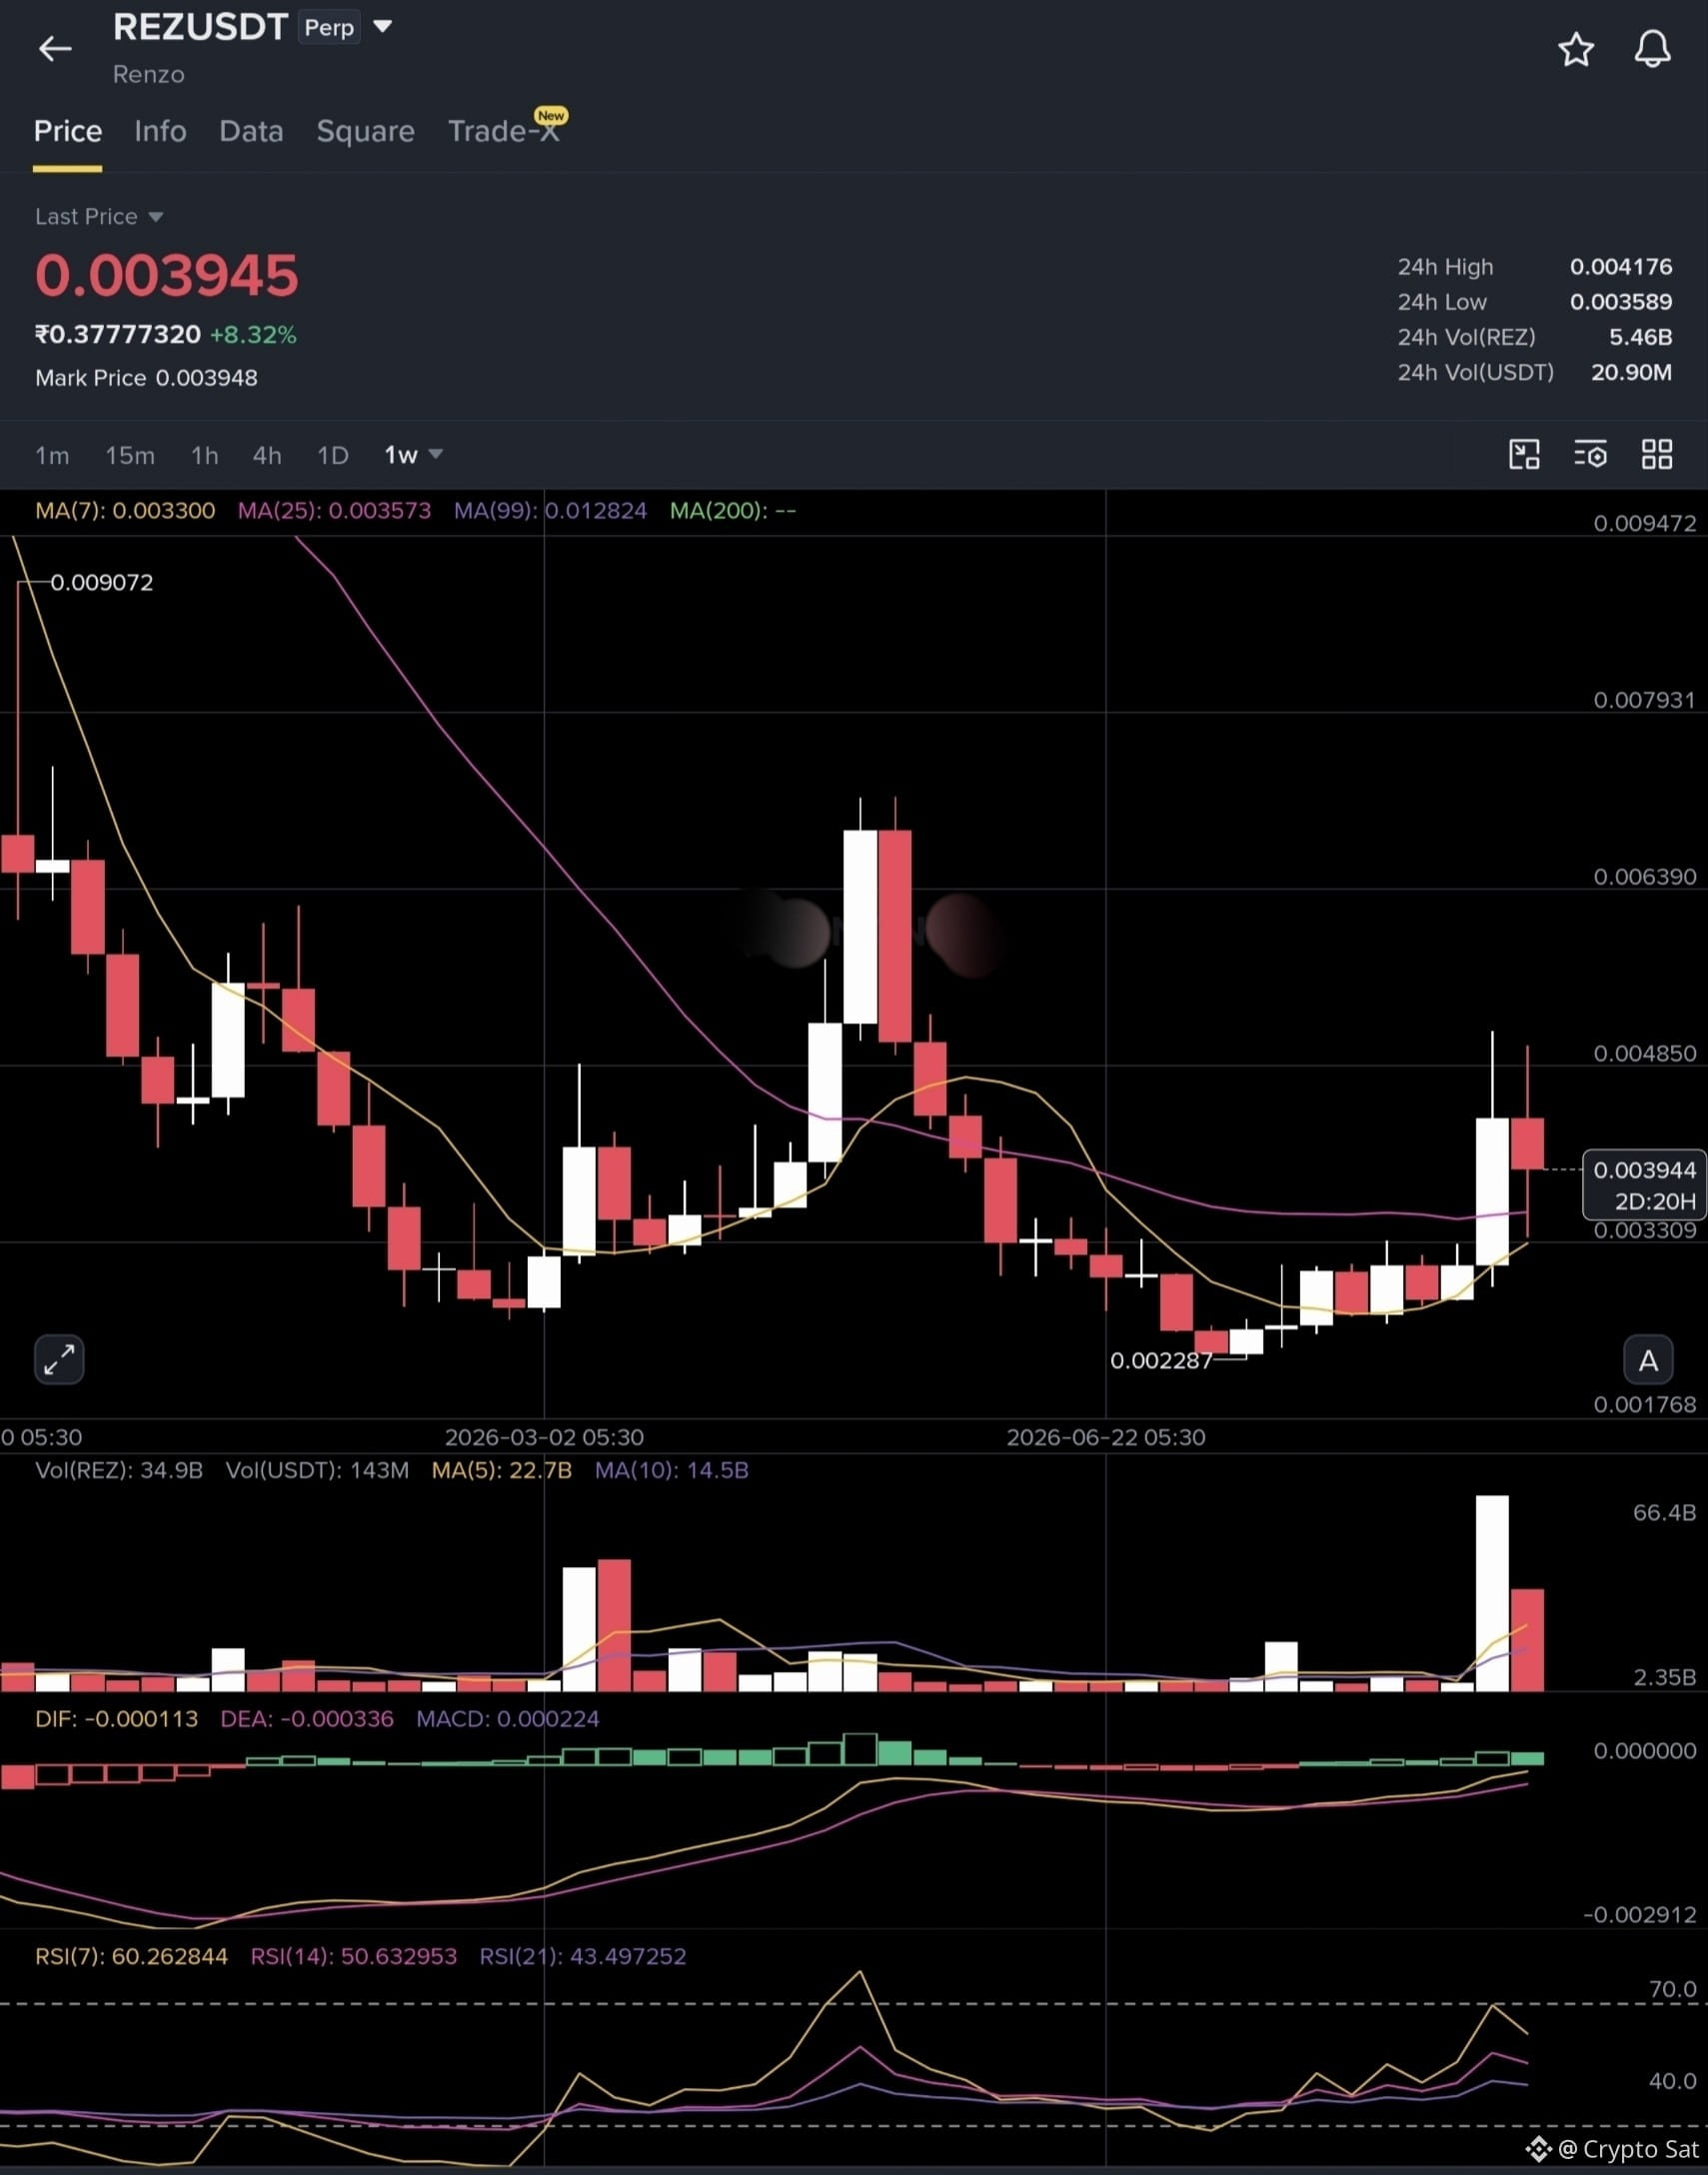
Looking at the charts, the weekly chart is bullish. After a consolidation, the price woke up, rising 41% last week and dropping 9% this week. It also tested the MA7 and MA25 levels. This seems like a perfect correction for another leg up. If the price holds these MA levels and consolidation occurs, we may see higher targets like 0.5, 0.7, and 0.9.
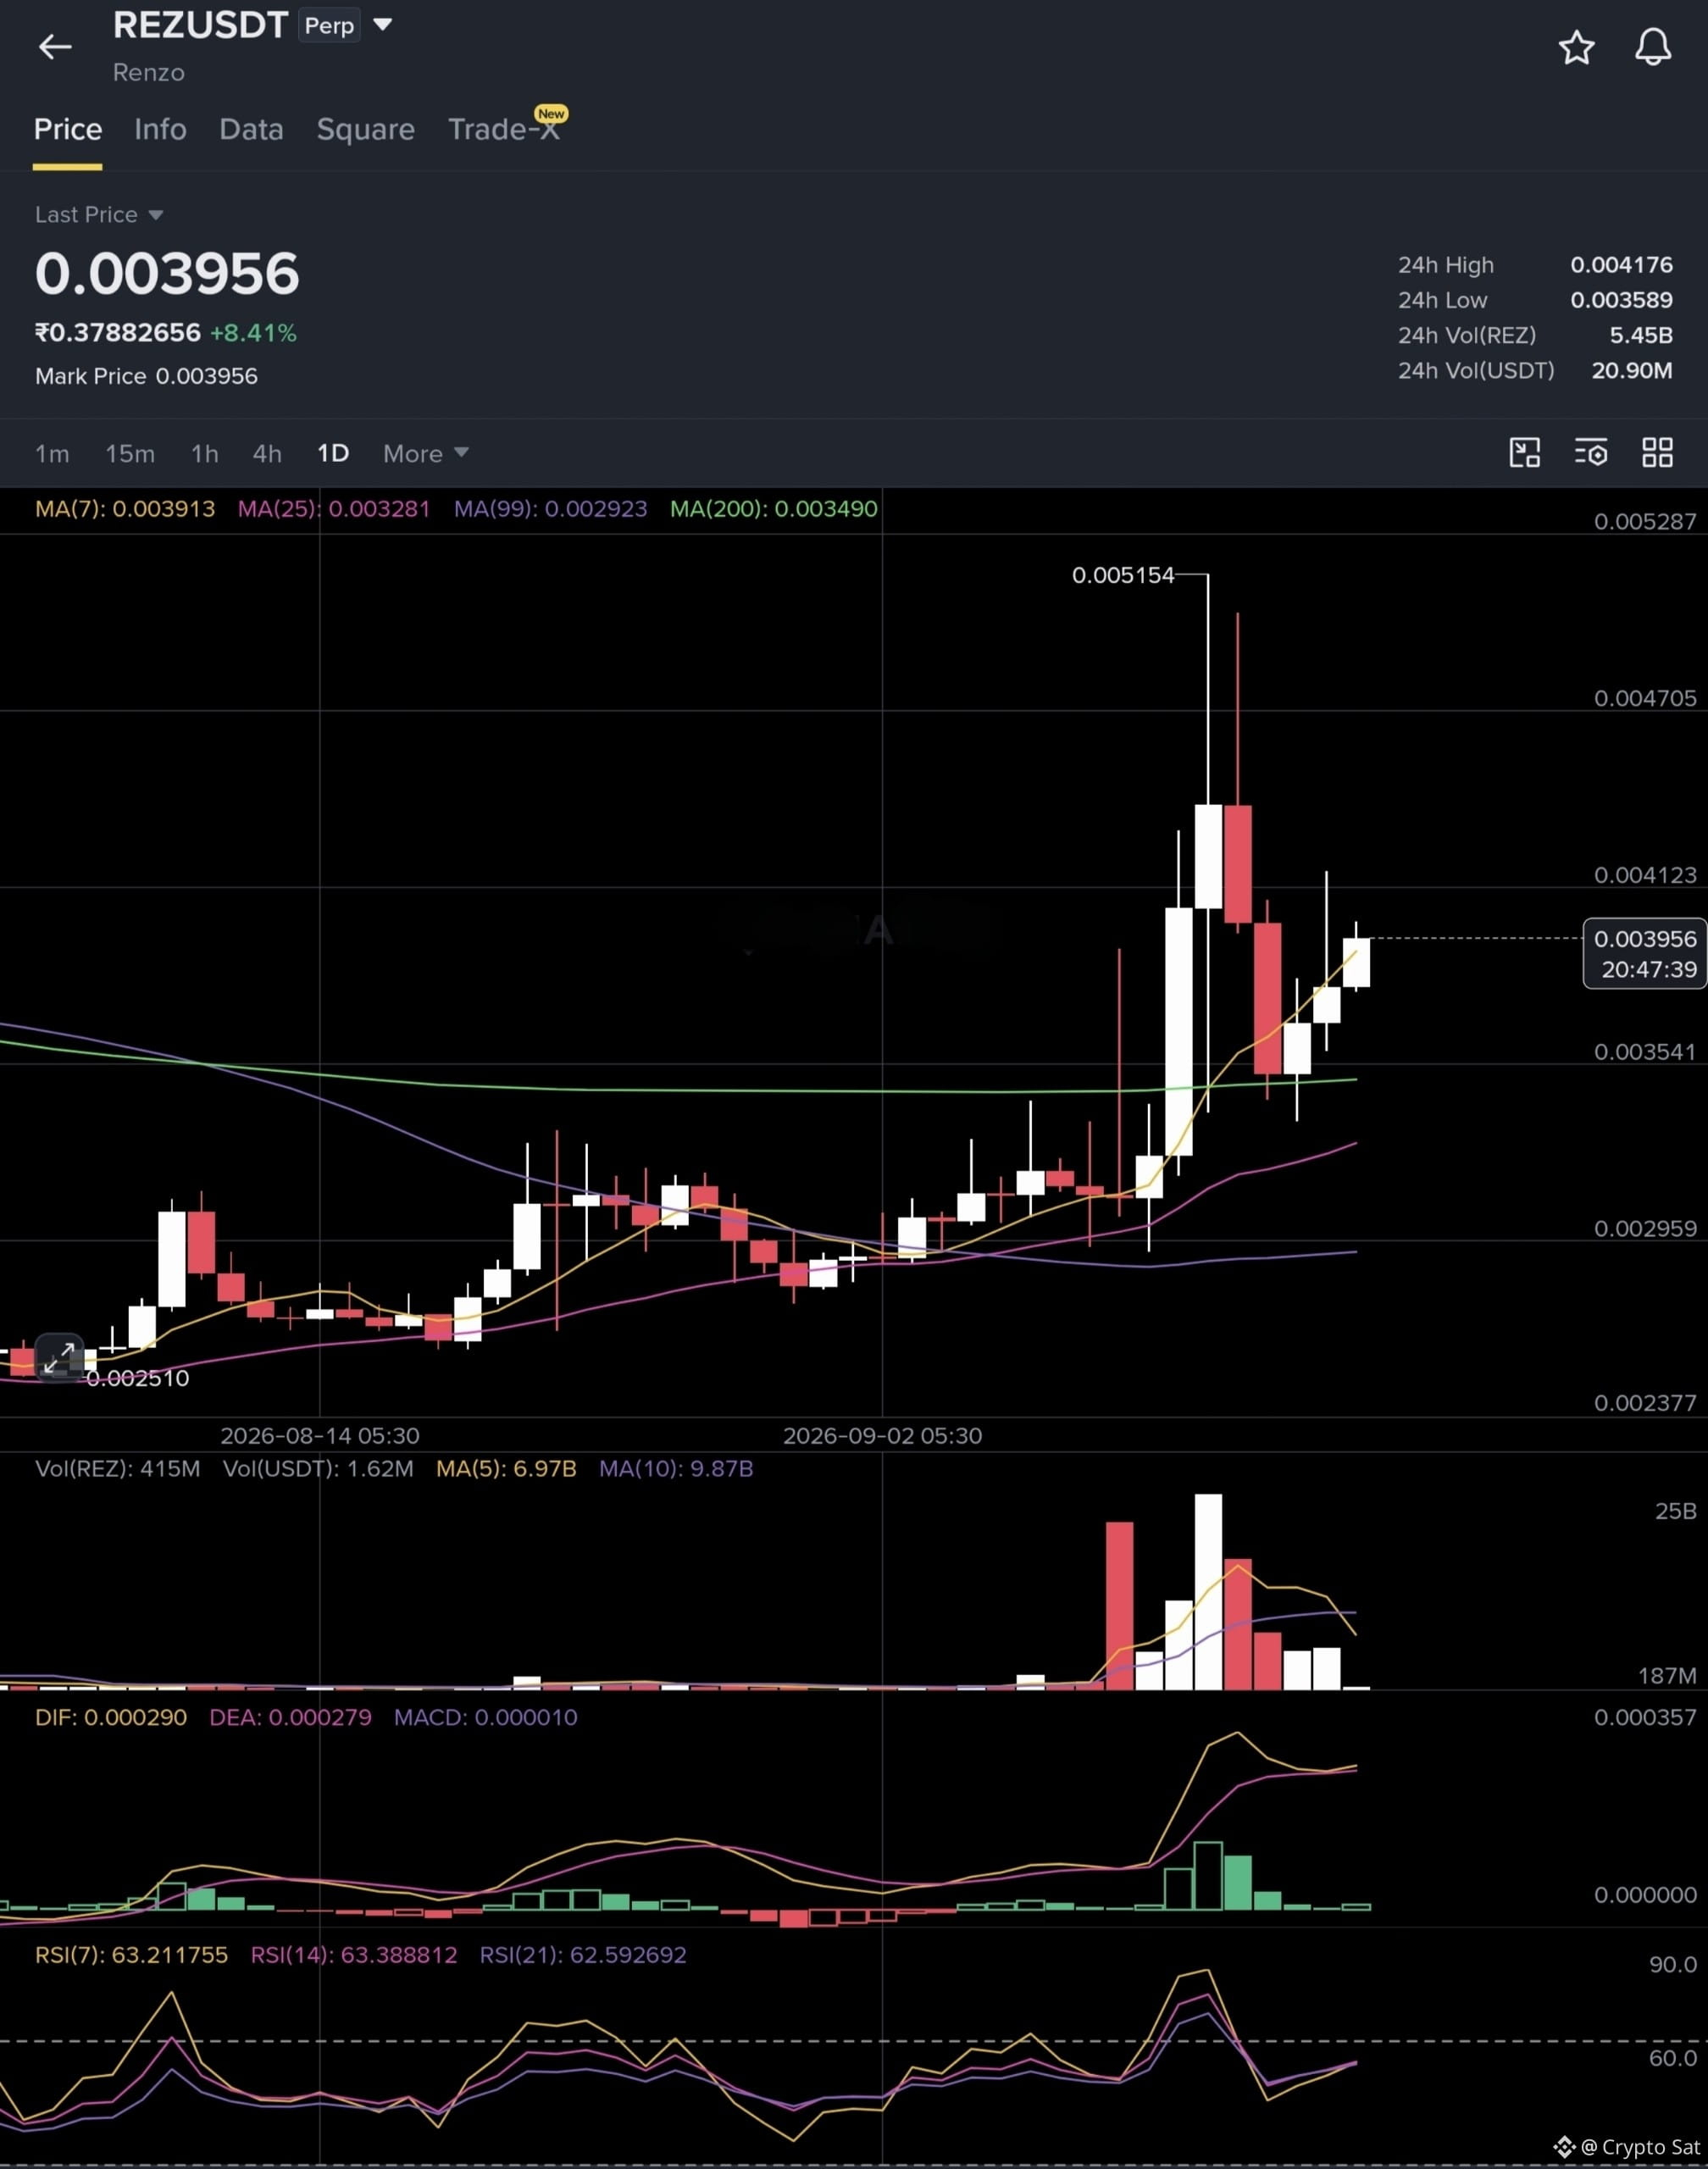
On the daily chart, we can see large candles from the past 10 days, indicating momentum. Just 3 days ago, the price corrected at the MA200 and bounced to 4170. I would say that as long as the price stays above the MA200, there is significant bullish potential. Keep your stop loss at 3280 (which is the MA25 at this moment).
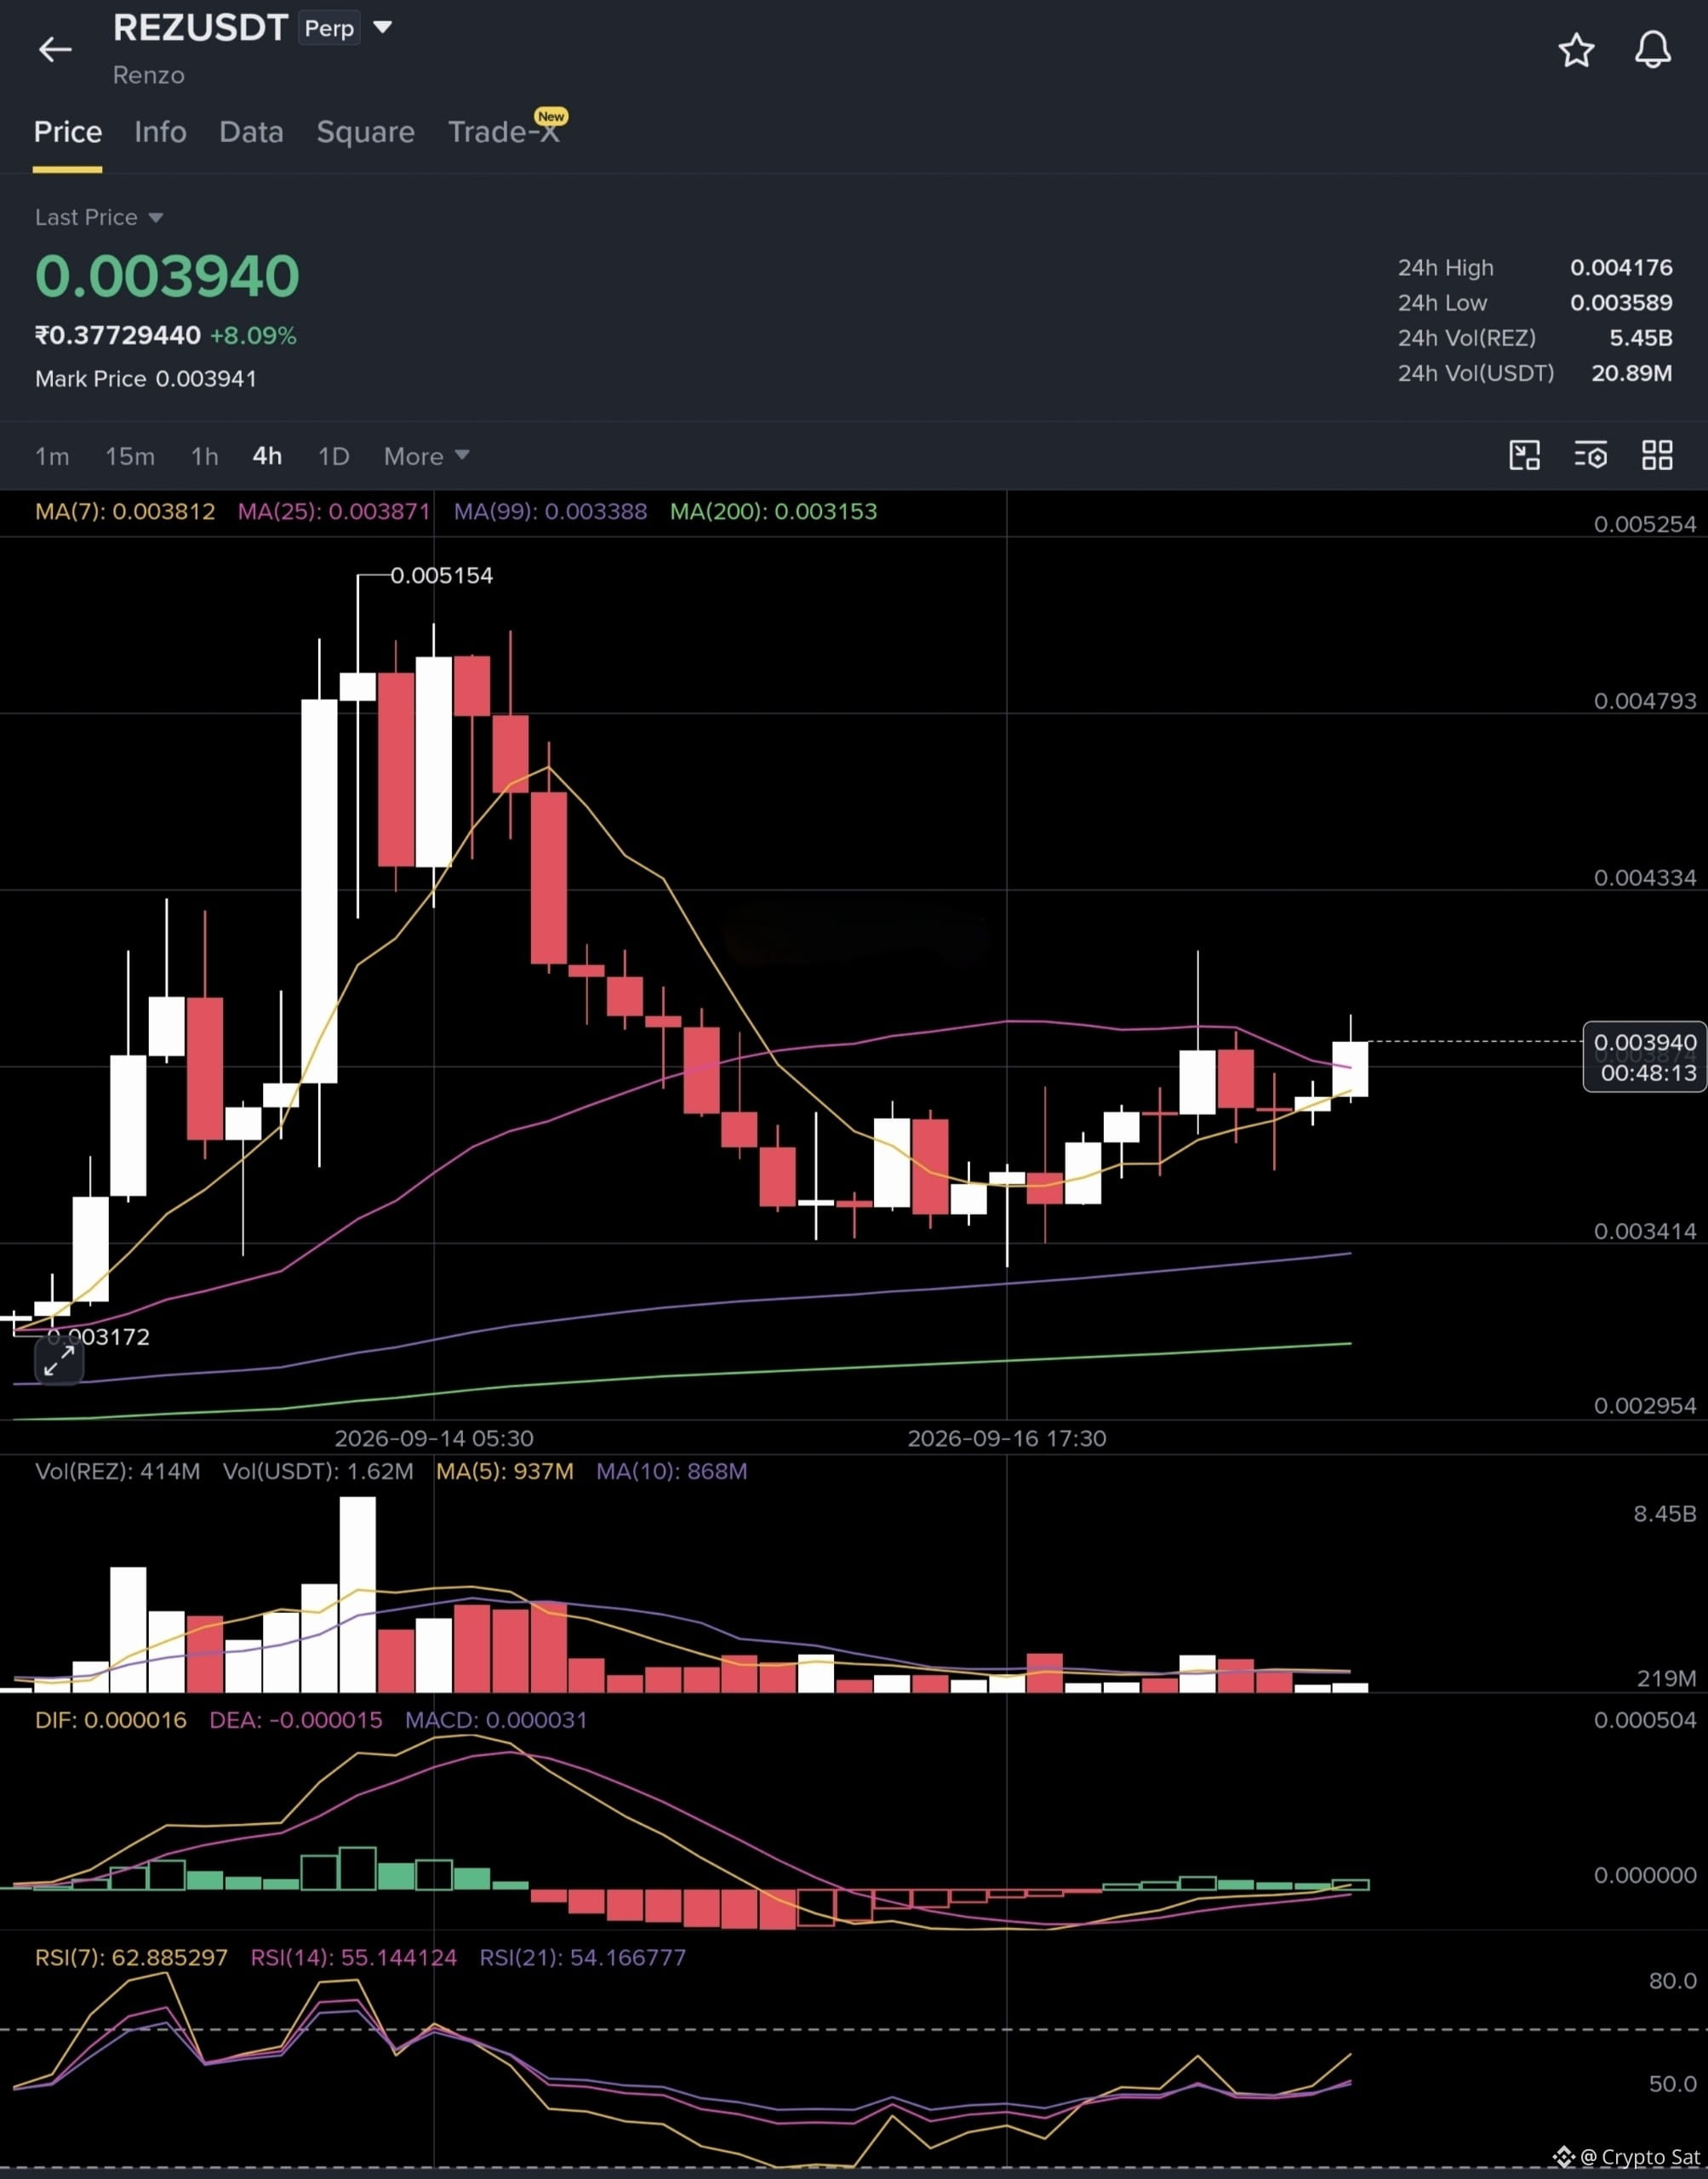
On the 4-hour chart, it is slightly bearish, with the MA25 curling down towards the MA7. However, the RSI is stepping into the overbought zone, and the MACD is sloping up. We had resistance at 4050 - 4180, so keep this in mind when taking positions. A breakout may push the price towards 43-45 at least, with an extension possible up to 0.005.
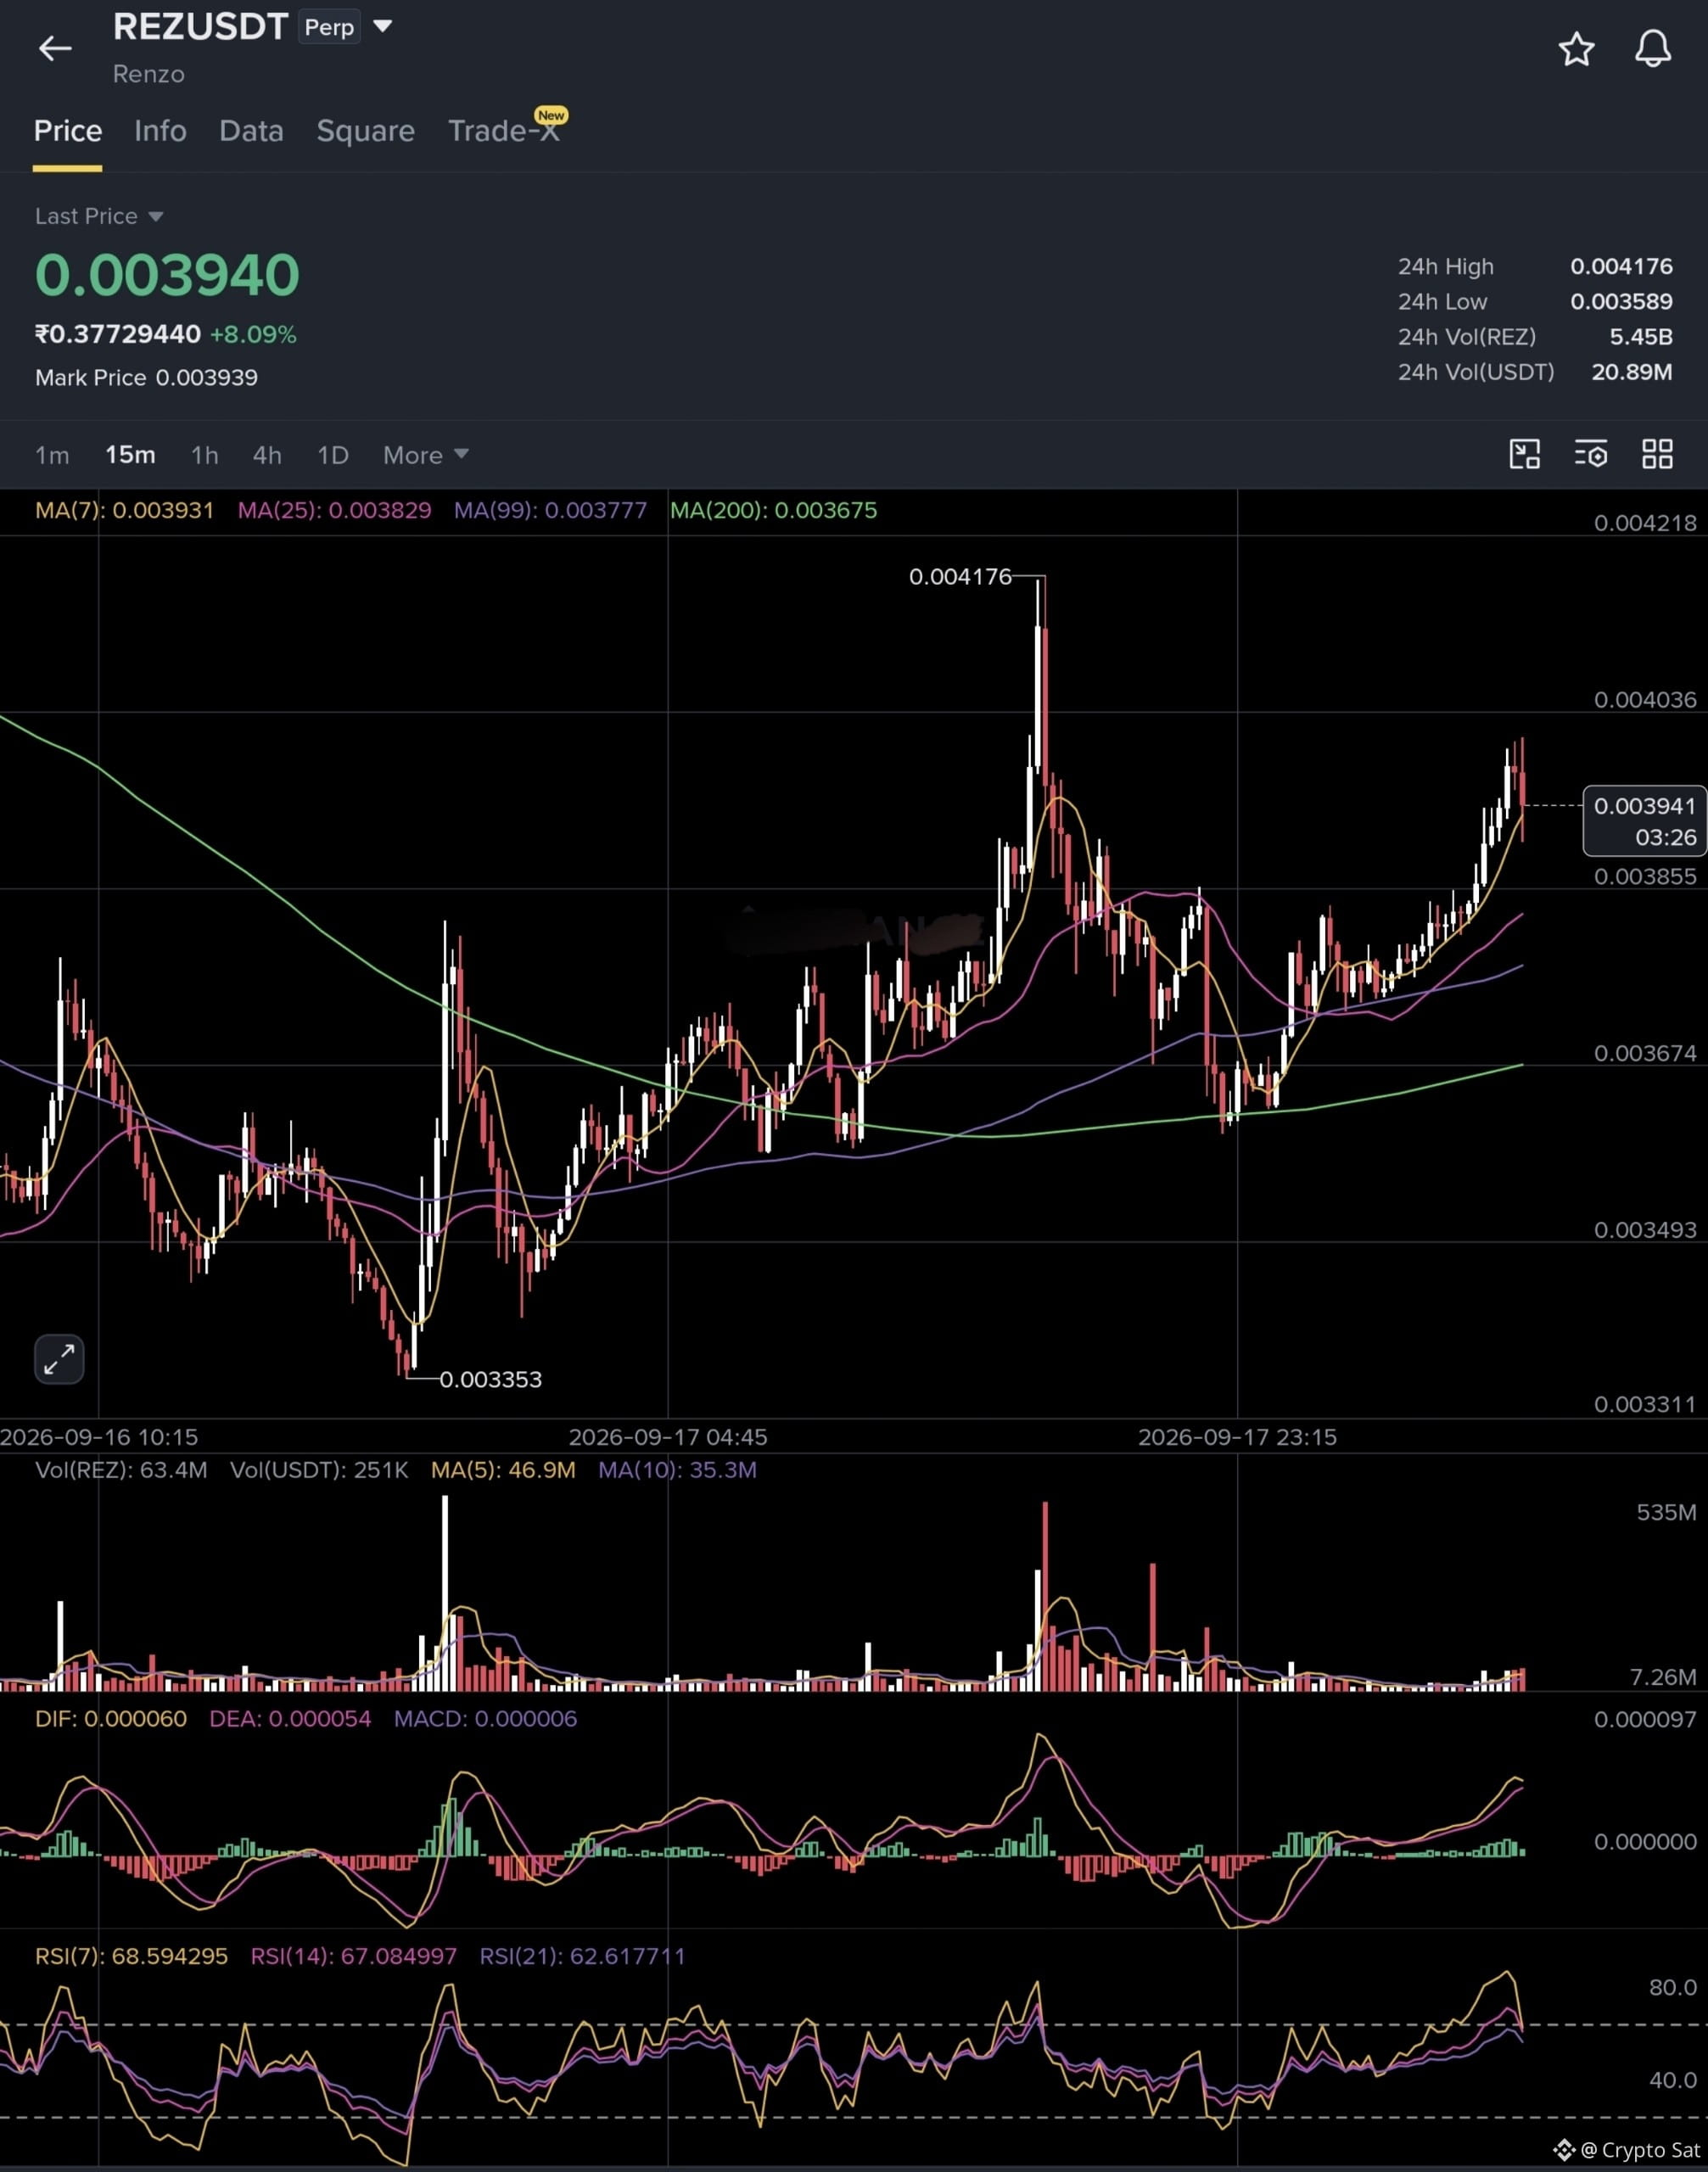
On the 15-minute chart, the price is holding the MA7 and MA25 as minor support, and the MA99 and MA200 as major support. RSI levels are in the overbought zone, so crazy moments may occur in the short term.
Focus on the current resistance reaction. Support sits at 0.00385-0.0038, with a possible loss towards 0.0034-0.0033.
Looking at the charts, the weekly chart is bullish. After a consolidation, the price woke up, rising 41% last week and dropping 9% this week. It also tested the MA7 and MA25 levels. This seems like a perfect correction for another leg up. If the price holds these MA levels and consolidation occurs, we may see higher targets like 0.5, 0.7, and 0.9.
On the daily chart, we can see large candles from the past 10 days, indicating momentum. Just 3 days ago, the price corrected at the MA200 and bounced to 4170. I would say that as long as the price stays above the MA200, there is significant bullish potential. Keep your stop loss at 3280 (which is the MA25 at this moment).
On the 4-hour chart, it is slightly bearish, with the MA25 curling down towards the MA7. However, the RSI is stepping into the overbought zone, and the MACD is sloping up. We had resistance at 4050 - 4180, so keep this in mind when taking positions. A breakout may push the price towards 43-45 at least, with an extension possible up to 0.005.
On the 15-minute chart, the price is holding the MA7 and MA25 as minor support, and the MA99 and MA200 as major support. RSI levels are in the overbought zone, so crazy moments may occur in the short term.
Focus on the current resistance reaction. Support sits at 0.00385-0.0038, with a possible loss towards 0.0034-0.0033.