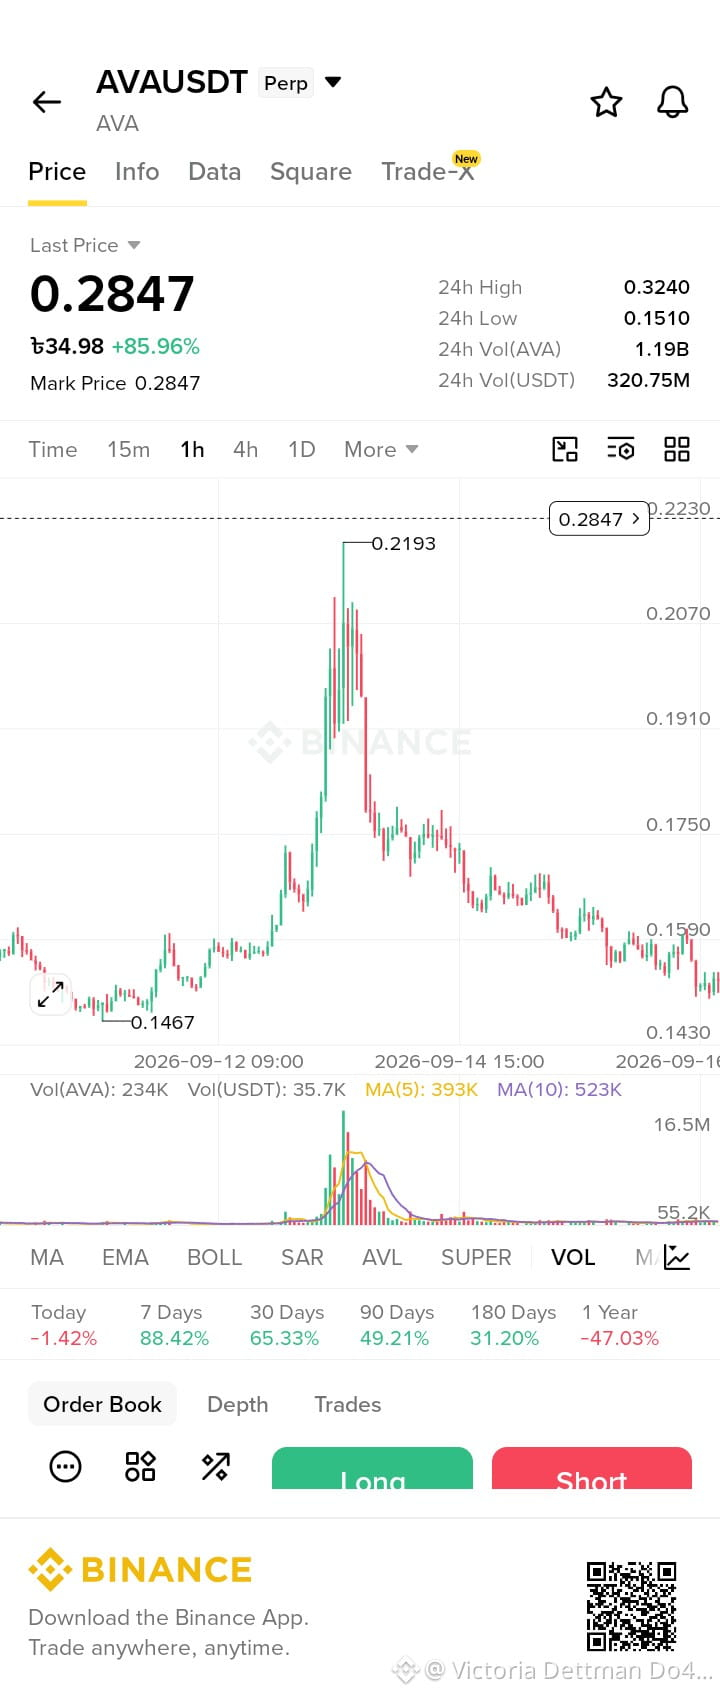
Current price: 0.2847 USDT, up about 85.96% in 24 hours.
24h high/low: 0.3240 / 0.1510 USDT.
On the 1-hour chart, AVA made a sharp pump and reached around 0.2193, followed by a strong pullback.
After the initial spike, the price formed a series of lower highs and lower lows, showing short-term selling pressure.
The recent candles are moving around the 0.15–0.16 area, which has acted as an important support zone.
Volume exploded during the major pump and then declined significantly, suggesting that the initial buying momentum has cooled.
If price breaks and holds above the recent resistance area, bullish momentum could strengthen. If it loses the nearby support zone, further downside could occur.
Overall: The chart shows a very volatile move with a major pump followed by a prolonged correction. Because the 24h move is already very large, risk is particularly high and the chart alone doesn't confirm a safe long or short entry.
24h high/low: 0.3240 / 0.1510 USDT.
On the 1-hour chart, AVA made a sharp pump and reached around 0.2193, followed by a strong pullback.
After the initial spike, the price formed a series of lower highs and lower lows, showing short-term selling pressure.
The recent candles are moving around the 0.15–0.16 area, which has acted as an important support zone.
Volume exploded during the major pump and then declined significantly, suggesting that the initial buying momentum has cooled.
If price breaks and holds above the recent resistance area, bullish momentum could strengthen. If it loses the nearby support zone, further downside could occur.
Overall: The chart shows a very volatile move with a major pump followed by a prolonged correction. Because the 24h move is already very large, risk is particularly high and the chart alone doesn't confirm a safe long or short entry.