There’s still plenty of fuel in the $AAVE move, but the chart is starting to show a little fatigue underneath the strength.
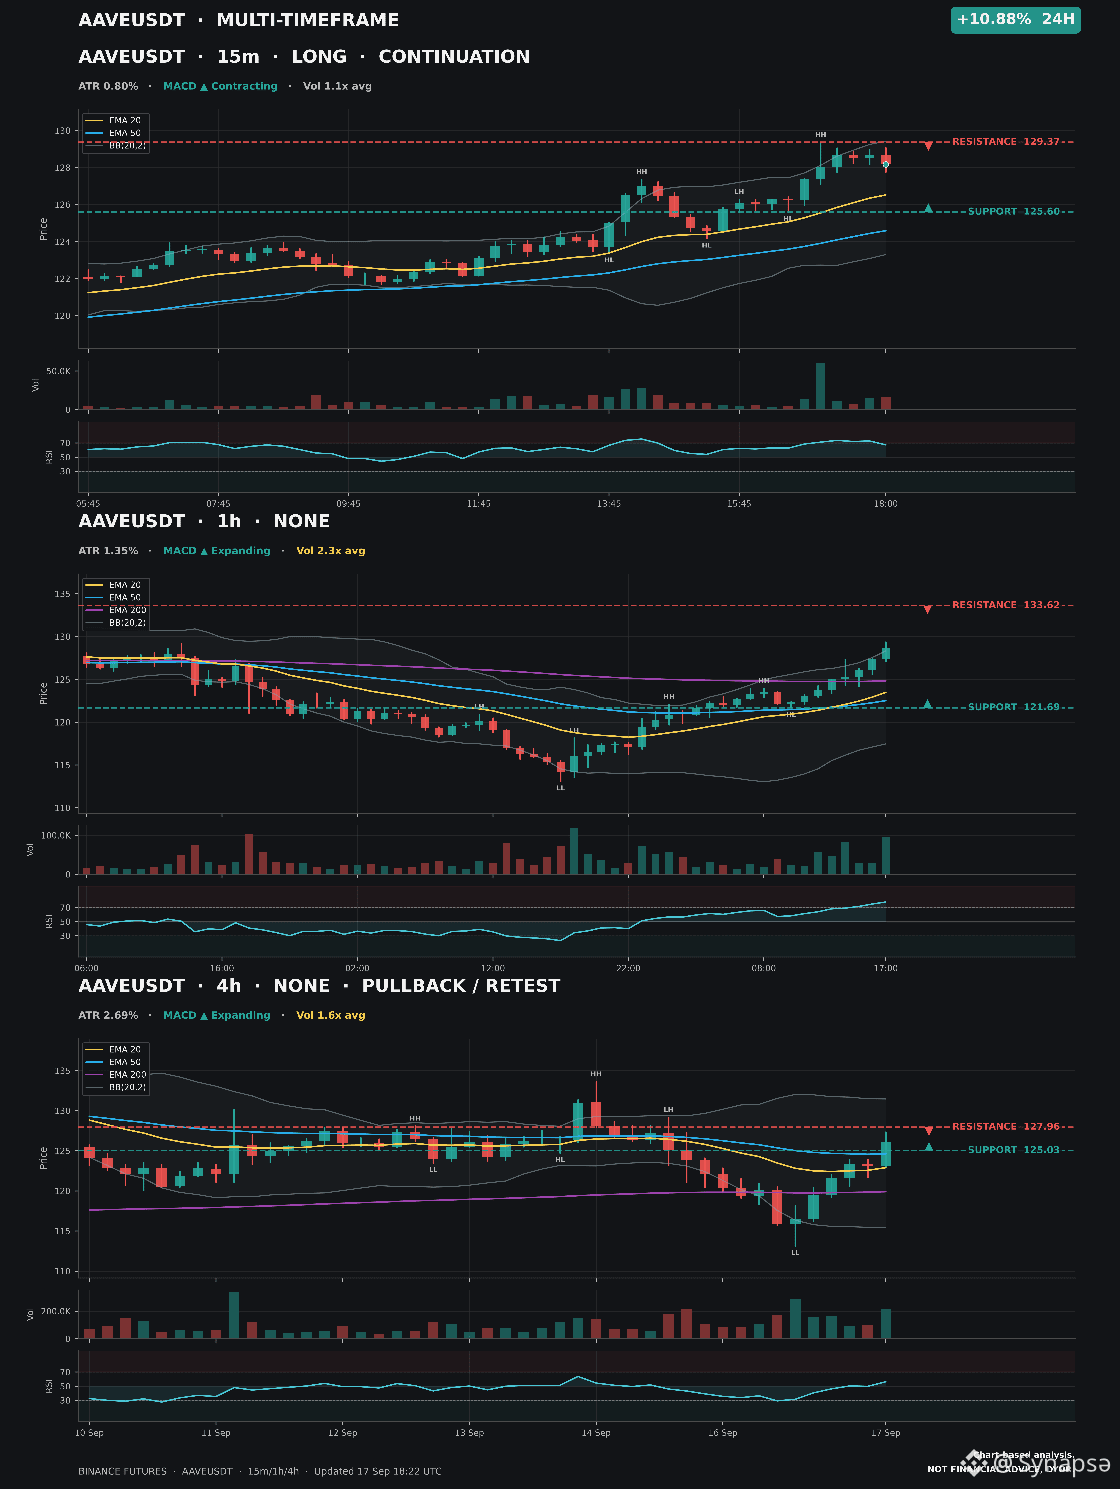
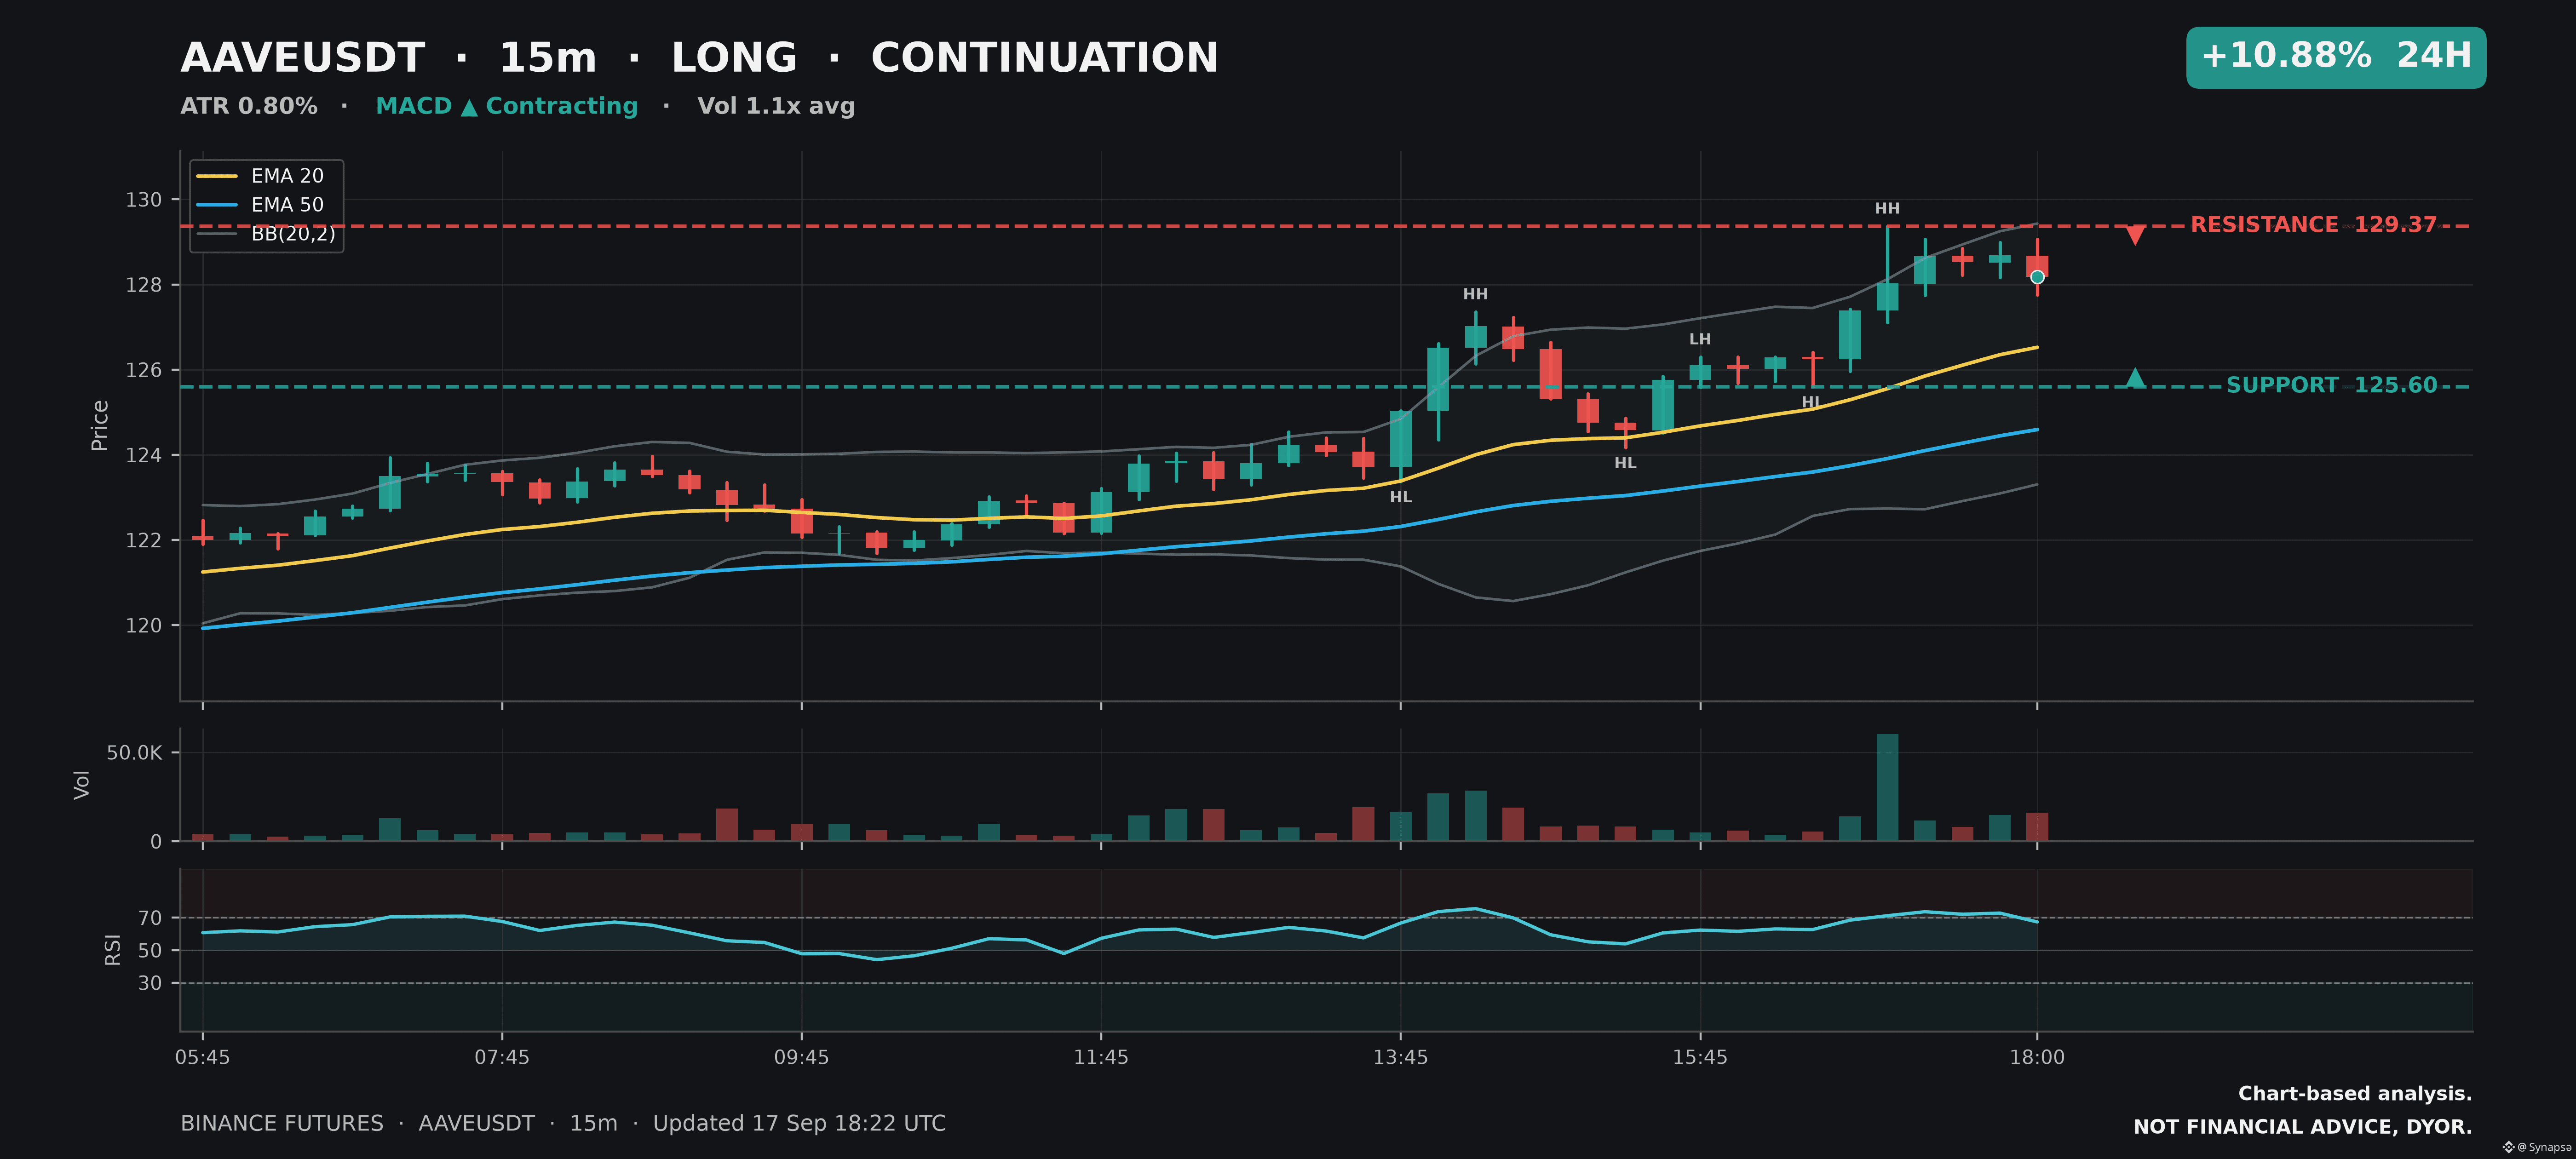
On 15m, buyers are still pushing the structure higher and the volume picture is healthy. RSI at 67.4 keeps the momentum bullish, but the lower RSI high against a higher price high is the bit I’d keep an eye on. It’s not a sell signal by itself, just a sign that the move may not have the same punch behind it as the candles suggest.
Entry: 127.72 - 128.18
SL: 125.63
TP1: 130.73
TP2: 132.78
The 1h is even more stretched, with RSI at 77.9 and price pressing the upper Bollinger area. Then the 4h throws another wrinkle into the picture: indicators are leaning bullish, but the actual swing structure is still bearish. So this is very much a short-term momentum trade, not a clean across-the-board bullish chart. I'd keep size sensible and give the trade room without letting one fast candle dictate the whole position.
On 15m, buyers are still pushing the structure higher and the volume picture is healthy. RSI at 67.4 keeps the momentum bullish, but the lower RSI high against a higher price high is the bit I’d keep an eye on. It’s not a sell signal by itself, just a sign that the move may not have the same punch behind it as the candles suggest.
Entry: 127.72 - 128.18
SL: 125.63
TP1: 130.73
TP2: 132.78
The 1h is even more stretched, with RSI at 77.9 and price pressing the upper Bollinger area. Then the 4h throws another wrinkle into the picture: indicators are leaning bullish, but the actual swing structure is still bearish. So this is very much a short-term momentum trade, not a clean across-the-board bullish chart. I'd keep size sensible and give the trade room without letting one fast candle dictate the whole position.