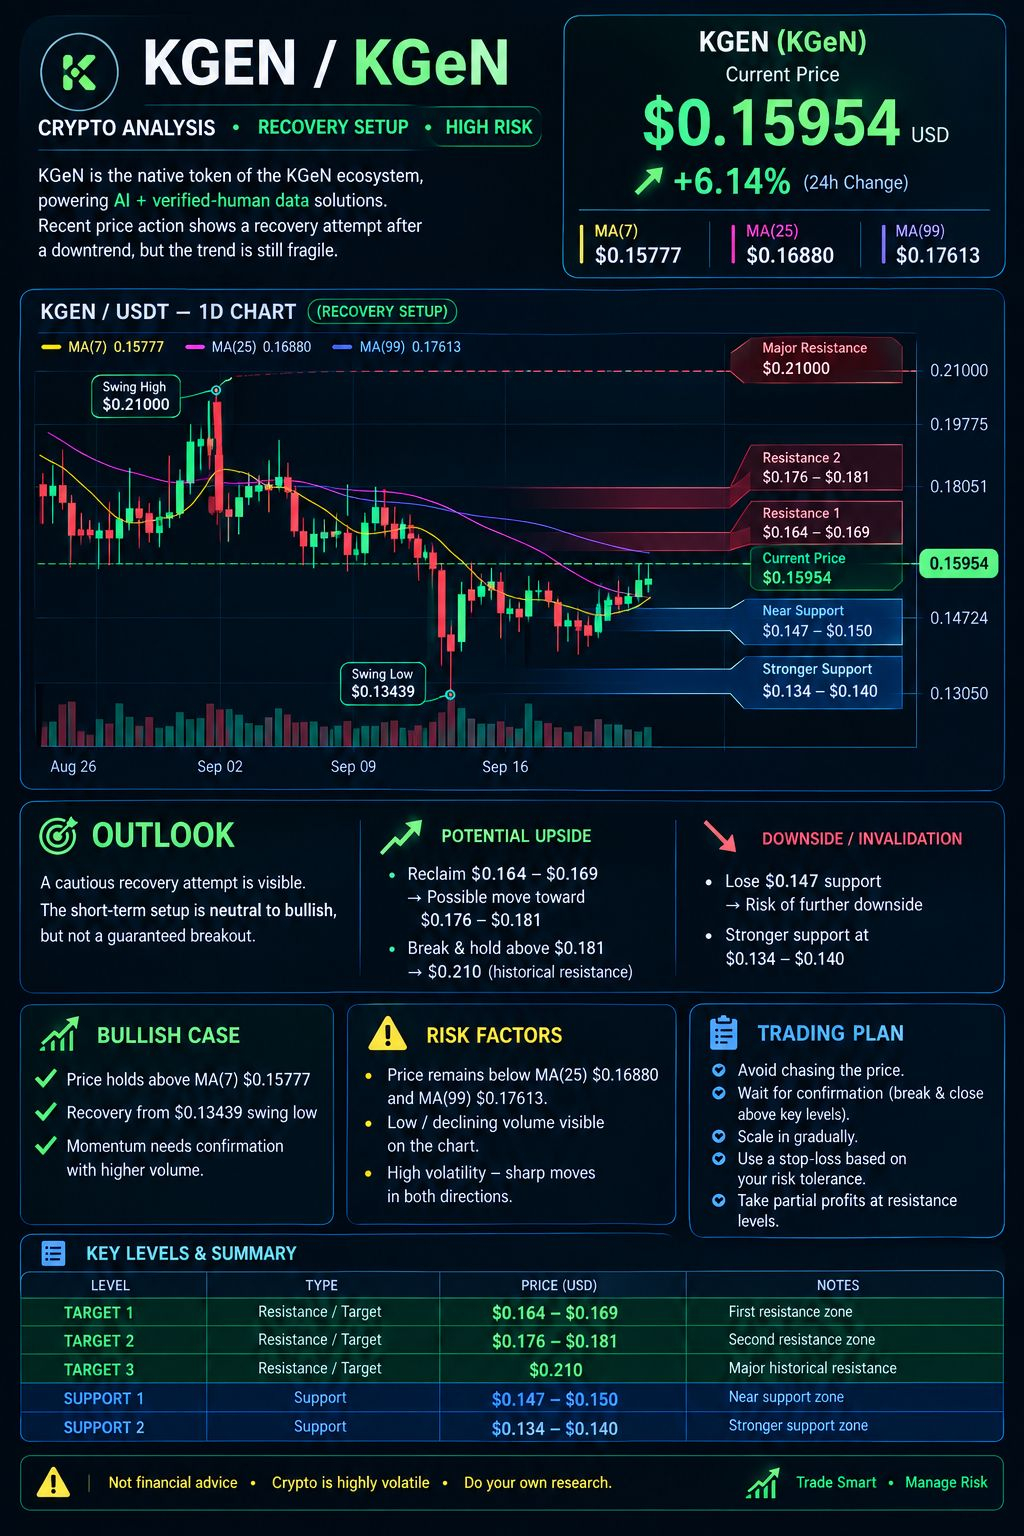
KGEN is showing a recovery attempt with high volatility, but the current setup still requires confirmation before taking a trade.
Past Performance:
KGEN recently faced strong selling pressure, falling from around $0.18–$0.21 toward the $0.13439 swing low. The price has since recovered toward the $0.1595 area, showing buyers are attempting to regain control.
Current Technical Structure:
The key near-term support zone is $0.147–$0.150, while stronger support sits around $0.134–$0.140. On the upside, the first important resistance is $0.164–$0.169, followed by $0.176–$0.181. A major historical resistance is near $0.210.
The price is around MA(7) but remains below MA(25) and MA(99), meaning the recovery has not yet confirmed a strong bullish trend.
Future Scenarios:
If KGEN breaks and holds above $0.169 with strong volume, it could potentially test $0.176–$0.181, with $0.210 becoming a higher resistance area. Conversely, losing $0.147 could expose the $0.134–$0.140 support zone.
Trading Plan:
Rather than chasing the current move, traders could watch for breakout confirmation or a strong support reaction. Use controlled position sizing, stop-loss protection, and consider partial profit-taking at resistance levels.
#KGENSetup #kgenstrategy $KGEN
Past Performance:
KGEN recently faced strong selling pressure, falling from around $0.18–$0.21 toward the $0.13439 swing low. The price has since recovered toward the $0.1595 area, showing buyers are attempting to regain control.
Current Technical Structure:
The key near-term support zone is $0.147–$0.150, while stronger support sits around $0.134–$0.140. On the upside, the first important resistance is $0.164–$0.169, followed by $0.176–$0.181. A major historical resistance is near $0.210.
The price is around MA(7) but remains below MA(25) and MA(99), meaning the recovery has not yet confirmed a strong bullish trend.
Future Scenarios:
If KGEN breaks and holds above $0.169 with strong volume, it could potentially test $0.176–$0.181, with $0.210 becoming a higher resistance area. Conversely, losing $0.147 could expose the $0.134–$0.140 support zone.
Trading Plan:
Rather than chasing the current move, traders could watch for breakout confirmation or a strong support reaction. Use controlled position sizing, stop-loss protection, and consider partial profit-taking at resistance levels.
#KGENSetup #kgenstrategy $KGEN