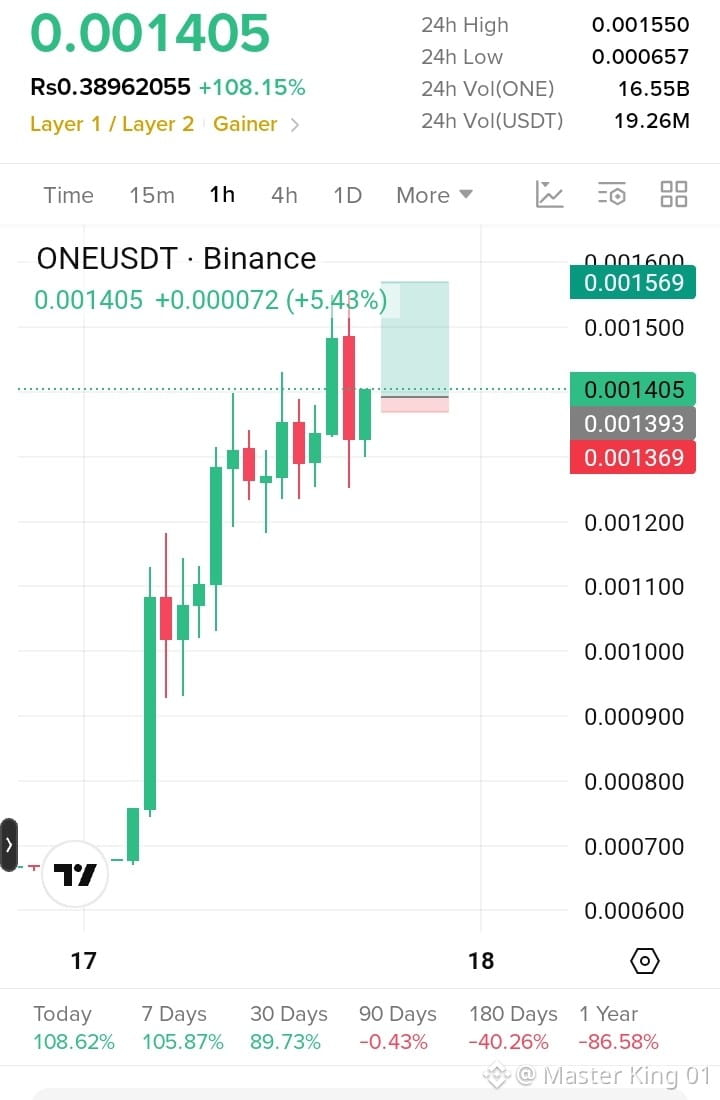
$ONE /USDT — 1H Chart Analysis
Current price: 0.001405
24H change: +108%
Trend: 🟢 Strong bullish, but highly volatile after a huge move.
Key levels from the chart:
🟢 Support: 0.00137–0.00139
🟢 Stronger support: 0.00130–0.00132
🔴 Resistance: 0.00150
🔴 Major resistance/target: 0.00155–0.00157
Possible scenarios
Bullish:
If 1H candles hold above 0.00139–0.00140 and price breaks 0.00150, the chart could attempt 0.00155–0.00157.
Bearish:
If 0.00137 breaks decisively, a pullback toward 0.00130 becomes possible, with 0.00125 as another area to watch.
⚠️ Because ONE has already moved more than 100% today, chasing a green candle carries elevated pullback risk. A retest/hold of support is technically cleaner than entering after a sharp vertical move.
Chart setup shown: Entry ≈ 0.001393, stop ≈ 0.001369, target ≈ 0.001569.
That gives roughly 2.7:1 reward/risk based purely on the levels drawn.
Current price: 0.001405
24H change: +108%
Trend: 🟢 Strong bullish, but highly volatile after a huge move.
Key levels from the chart:
🟢 Support: 0.00137–0.00139
🟢 Stronger support: 0.00130–0.00132
🔴 Resistance: 0.00150
🔴 Major resistance/target: 0.00155–0.00157
Possible scenarios
Bullish:
If 1H candles hold above 0.00139–0.00140 and price breaks 0.00150, the chart could attempt 0.00155–0.00157.
Bearish:
If 0.00137 breaks decisively, a pullback toward 0.00130 becomes possible, with 0.00125 as another area to watch.
⚠️ Because ONE has already moved more than 100% today, chasing a green candle carries elevated pullback risk. A retest/hold of support is technically cleaner than entering after a sharp vertical move.
Chart setup shown: Entry ≈ 0.001393, stop ≈ 0.001369, target ≈ 0.001569.
That gives roughly 2.7:1 reward/risk based purely on the levels drawn.