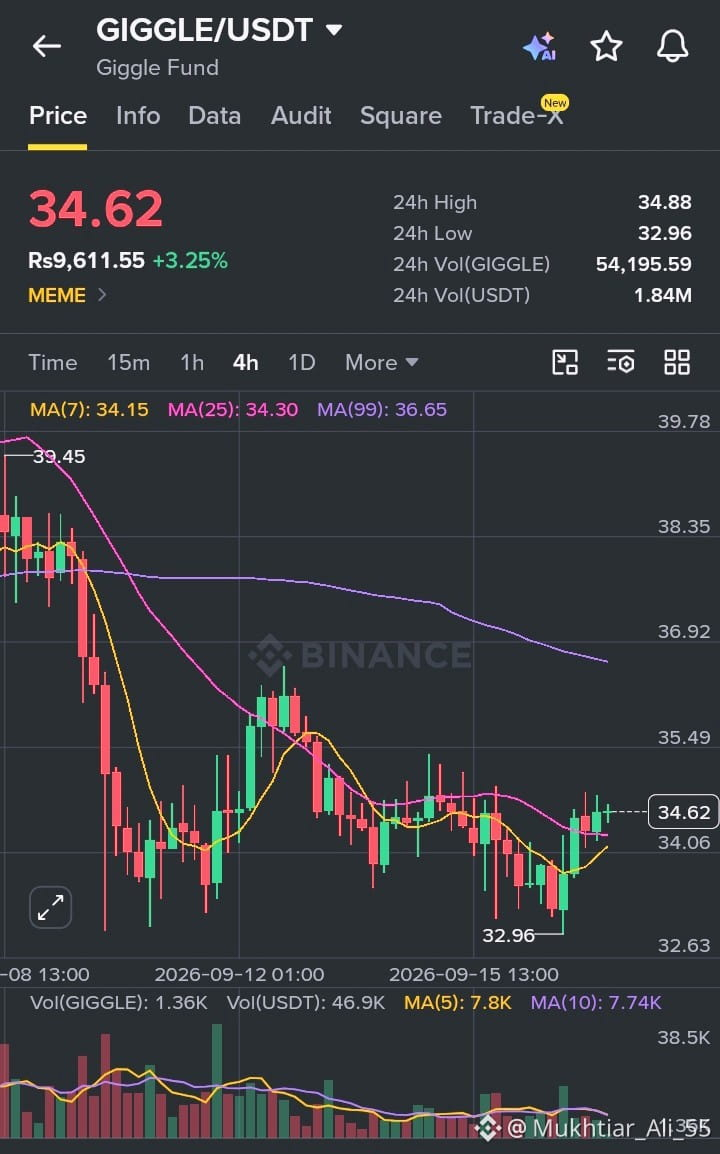
🚨 GIGGLE/USDT FINDING STABILITY AT SUPPORT — WHAT THE CHART IS TELLING US 📈🔥
$GIGGLE | GIGGLE/USDT
💰 Price: 34.62
📈 24H Change: +3.25%
📊 24H High: 34.88
📉 24H Low: 32.96
💵 24H Volume (USDT): 1.84M (54,195.59 GIGGLE)
⚠️ Market Overview (4H Timeframe):
Giggle Fund is showing signs of recovery after holding its ground near crucial lows 🧨
🔻 Price bounced cleanly from the 32.96 support zone, showing strong buyer defense
🔻 Bullish momentum candles are starting to build up after previous consolidation
🔻 A long lower wick confirms active demand and strong accumulation at lower levels 🧲
📉 Moving Averages Tell the Story:
📌 MA(7): 34.15
📌 MA(25): 34.30
📌 MA(99): 36.65
✨ Price has crossed back above short-term MAs (MA 7 & MA 25)
⚖️ Structure is attempting a reversal from local lows
🐂 Buyers are stepping in to challenge overhead supply
📊 Volume Insight:
🟢 Consistent volume building on minor dips and recovery pushes
💥 Indicates steady accumulation rather than reckless FOMO buying
⚠️ Volatility remains part of the game — manage exposure wisely
🧠 What This Means:
This stabilization phase shows a healthy reaction off key demand levels ❌/✔️
This looks like a structural reset and gradual base-building
🔹 Short-term trend: Neutral to Bullish recovery
🔹 Momentum: Improving
🔹 Market emotion: Cautiously optimistic 🧐
🎯 Key Levels to Watch:
🟢 Support: 32.90 – 34.00 zone
🔴 Resistance: 35.50 – 36.65 zone
📌 A solid break and hold above MA(99) near 36.65 is needed for a strong continuation upward 🚀
📌 Failure to maintain the 34.00 handle could retest local support bounds ⬇️
💡 Final Take:
🧨 GIGGLE is transitioning into a crucial recovery test
🧘 Patience > emotions
🛡️ Risk management is critical
Markets reward discipline and preparation 💎
#GIGGLE #CryptoTrading #BinanceSquare #Altcoins #TechnicalAnalysis
$GIGGLE
$GIGGLE | GIGGLE/USDT
💰 Price: 34.62
📈 24H Change: +3.25%
📊 24H High: 34.88
📉 24H Low: 32.96
💵 24H Volume (USDT): 1.84M (54,195.59 GIGGLE)
⚠️ Market Overview (4H Timeframe):
Giggle Fund is showing signs of recovery after holding its ground near crucial lows 🧨
🔻 Price bounced cleanly from the 32.96 support zone, showing strong buyer defense
🔻 Bullish momentum candles are starting to build up after previous consolidation
🔻 A long lower wick confirms active demand and strong accumulation at lower levels 🧲
📉 Moving Averages Tell the Story:
📌 MA(7): 34.15
📌 MA(25): 34.30
📌 MA(99): 36.65
✨ Price has crossed back above short-term MAs (MA 7 & MA 25)
⚖️ Structure is attempting a reversal from local lows
🐂 Buyers are stepping in to challenge overhead supply
📊 Volume Insight:
🟢 Consistent volume building on minor dips and recovery pushes
💥 Indicates steady accumulation rather than reckless FOMO buying
⚠️ Volatility remains part of the game — manage exposure wisely
🧠 What This Means:
This stabilization phase shows a healthy reaction off key demand levels ❌/✔️
This looks like a structural reset and gradual base-building
🔹 Short-term trend: Neutral to Bullish recovery
🔹 Momentum: Improving
🔹 Market emotion: Cautiously optimistic 🧐
🎯 Key Levels to Watch:
🟢 Support: 32.90 – 34.00 zone
🔴 Resistance: 35.50 – 36.65 zone
📌 A solid break and hold above MA(99) near 36.65 is needed for a strong continuation upward 🚀
📌 Failure to maintain the 34.00 handle could retest local support bounds ⬇️
💡 Final Take:
🧨 GIGGLE is transitioning into a crucial recovery test
🧘 Patience > emotions
🛡️ Risk management is critical
Markets reward discipline and preparation 💎
#GIGGLE #CryptoTrading #BinanceSquare #Altcoins #TechnicalAnalysis
$GIGGLE