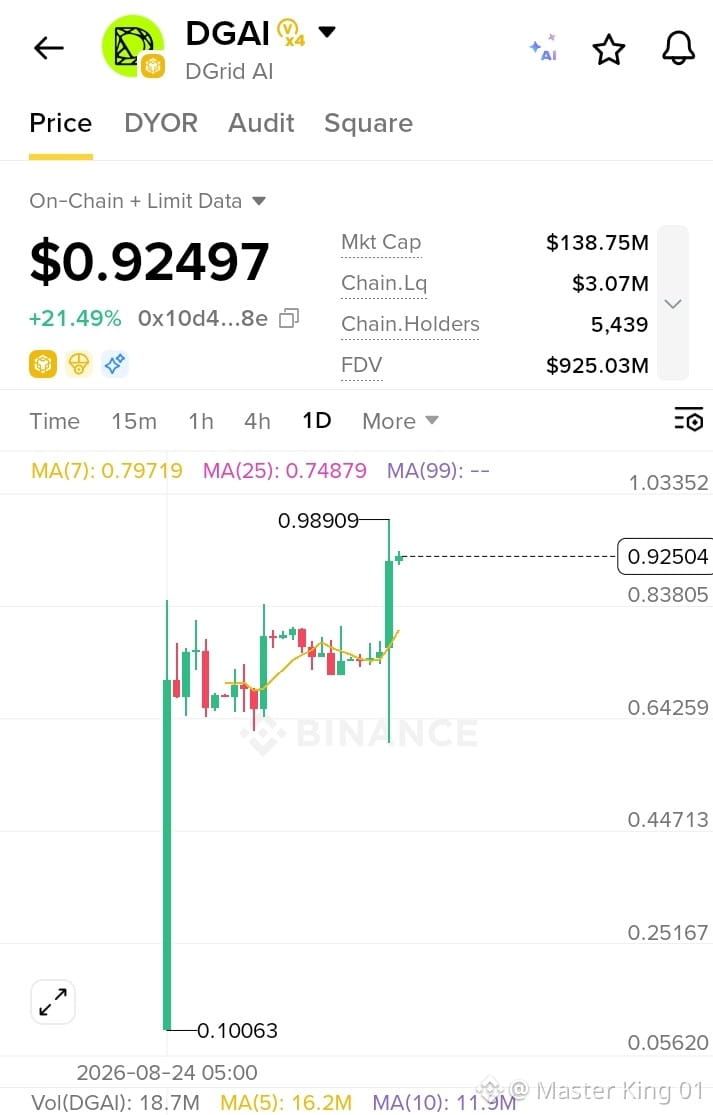
$DGAI I/USDT — 1D Chart Analysis 📊
Current price: ~$0.925
Daily change: +21.49%
Recent high: $0.989
MA(7): $0.797
MA(25): $0.749
The chart is showing a strong bullish breakout from the previous consolidation around $0.70–$0.80.
Key levels:
🟢 $0.88–$0.90: immediate support
🟢 $0.80–$0.82: stronger support / breakout area
🟡 $0.95–$0.99: major resistance; recent high is $0.989
🚀 Above $0.99: a daily close above this level would confirm another breakout attempt, with $1.03 as the next visible chart level.
⚠️ What I'd watch
The latest candle has a large bullish body and very high volume, which supports the breakout. But price is already extended significantly above both MA(7) and MA(25), so a pullback/retest is possible.
Rather than chasing around $0.925, the important reaction zones are $0.88–$0.90 and then $0.80–$0.82.
If price loses $0.80 on a daily closing basis, the current breakout structure would become substantially weaker.
Overall chart structure: bullish momentum, but approaching the psychological $1.00 resistance and therefore high volatility.
Current price: ~$0.925
Daily change: +21.49%
Recent high: $0.989
MA(7): $0.797
MA(25): $0.749
The chart is showing a strong bullish breakout from the previous consolidation around $0.70–$0.80.
Key levels:
🟢 $0.88–$0.90: immediate support
🟢 $0.80–$0.82: stronger support / breakout area
🟡 $0.95–$0.99: major resistance; recent high is $0.989
🚀 Above $0.99: a daily close above this level would confirm another breakout attempt, with $1.03 as the next visible chart level.
⚠️ What I'd watch
The latest candle has a large bullish body and very high volume, which supports the breakout. But price is already extended significantly above both MA(7) and MA(25), so a pullback/retest is possible.
Rather than chasing around $0.925, the important reaction zones are $0.88–$0.90 and then $0.80–$0.82.
If price loses $0.80 on a daily closing basis, the current breakout structure would become substantially weaker.
Overall chart structure: bullish momentum, but approaching the psychological $1.00 resistance and therefore high volatility.