$BR USDT (Bedrock) — 1H Chart Analysis
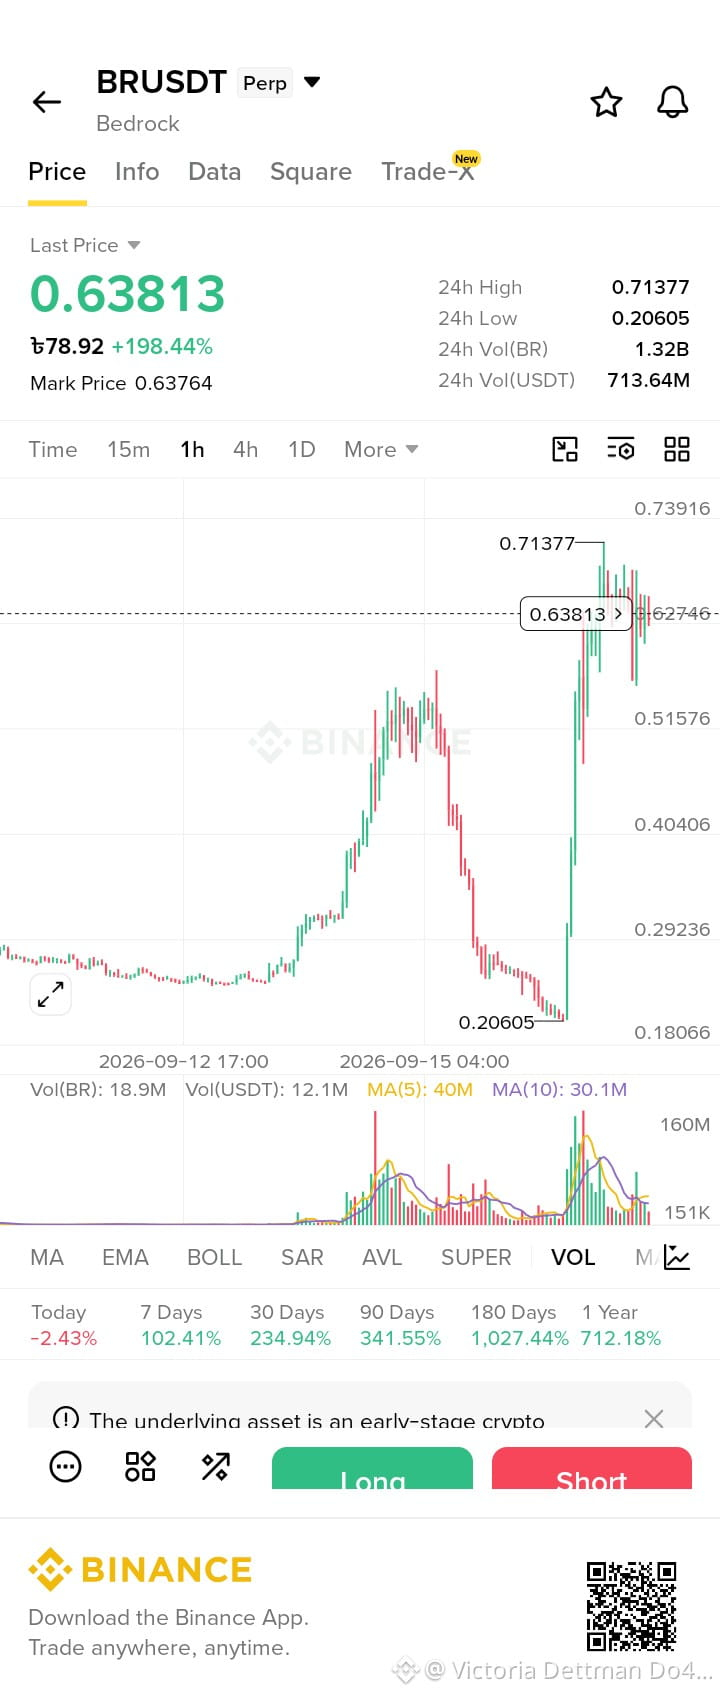
Current Price: 0.63813 USDT
24H High: 0.71377 USDT
24H Low: 0.20605 USDT
24H Change: +198.44%
24H Volume: Around 713.64M USDT
What the chart shows
1. Very strong bullish move: BRUSDT made a huge jump from around 0.20 to above 0.70, showing intense buying activity.
2. Resistance around 0.71: The price reached 0.71377 and then pulled back, suggesting sellers appeared around that level.
3. Current consolidation: Price is now moving around 0.63–0.65, with several candles showing uncertainty after the sharp pump.
4. Volume: Trading volume increased significantly during the big upward move, confirming that the move came with heavy market activity.
5. Short-term levels:
Resistance: 0.71–0.74
Current area: ~0.63–0.64
Lower visible support: around 0.52, then 0.40
Overall, the chart shows a very volatile market after an extremely large price increase. A break above the recent high or a loss of nearby support would change the short-term chart structure.
Current Price: 0.63813 USDT
24H High: 0.71377 USDT
24H Low: 0.20605 USDT
24H Change: +198.44%
24H Volume: Around 713.64M USDT
What the chart shows
1. Very strong bullish move: BRUSDT made a huge jump from around 0.20 to above 0.70, showing intense buying activity.
2. Resistance around 0.71: The price reached 0.71377 and then pulled back, suggesting sellers appeared around that level.
3. Current consolidation: Price is now moving around 0.63–0.65, with several candles showing uncertainty after the sharp pump.
4. Volume: Trading volume increased significantly during the big upward move, confirming that the move came with heavy market activity.
5. Short-term levels:
Resistance: 0.71–0.74
Current area: ~0.63–0.64
Lower visible support: around 0.52, then 0.40
Overall, the chart shows a very volatile market after an extremely large price increase. A break above the recent high or a loss of nearby support would change the short-term chart structure.