#cryptotradingpro #BTC
🔥 $BTC /USD: Analysis Following the Political Storm
The US Senate rejected the Clarity Act (49–50), and the macroeconomic backdrop is unsettling the market with the prospect of sustained high interest rates. One might have expected a massive panic sell-off. Yet, what does the chart show?
The market has proven once again: liquidity is king.
📊 What is happening on the chart?
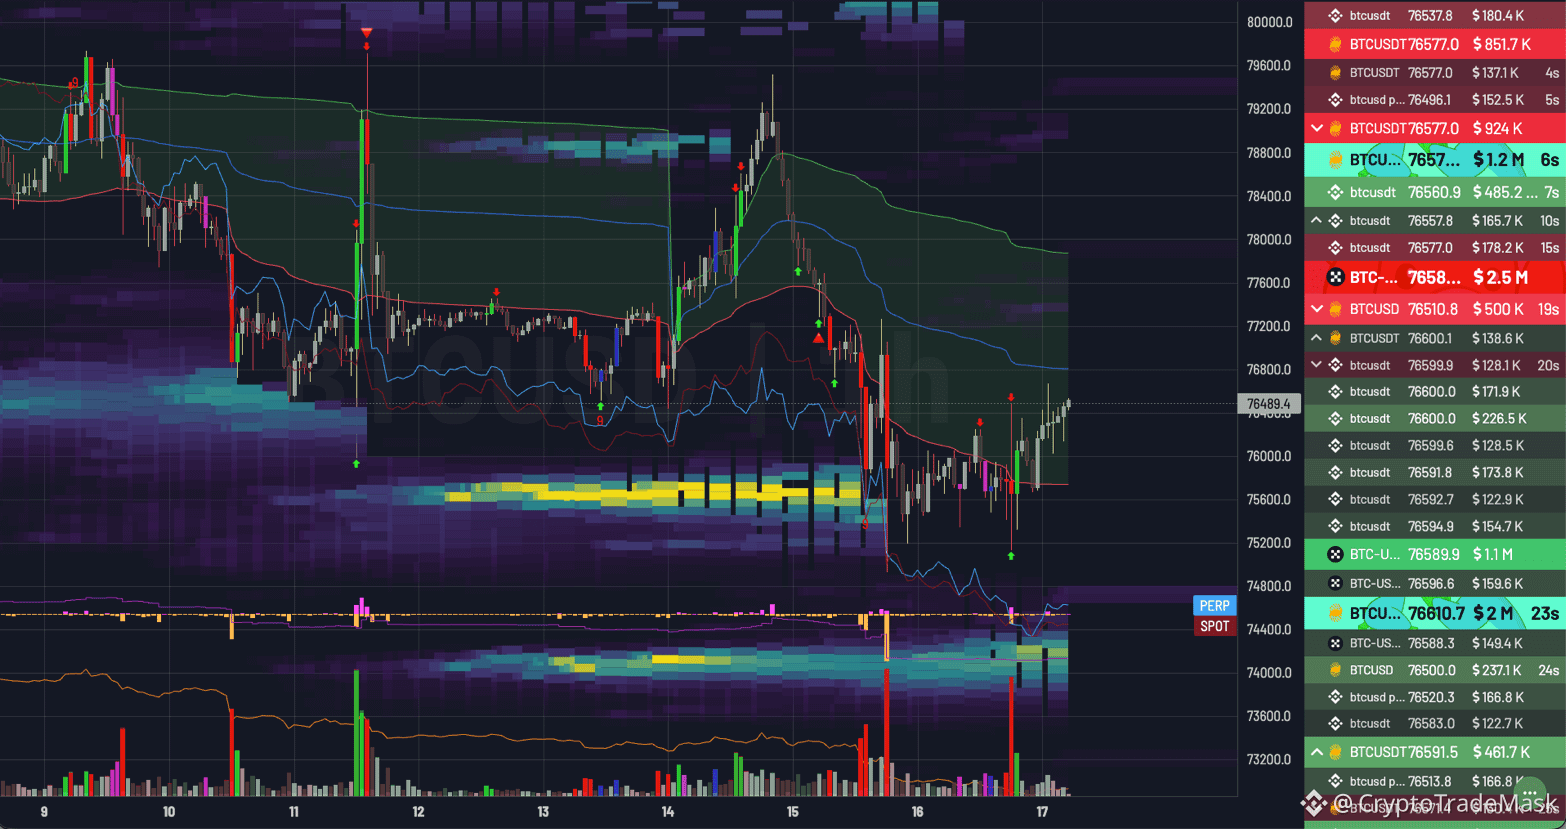
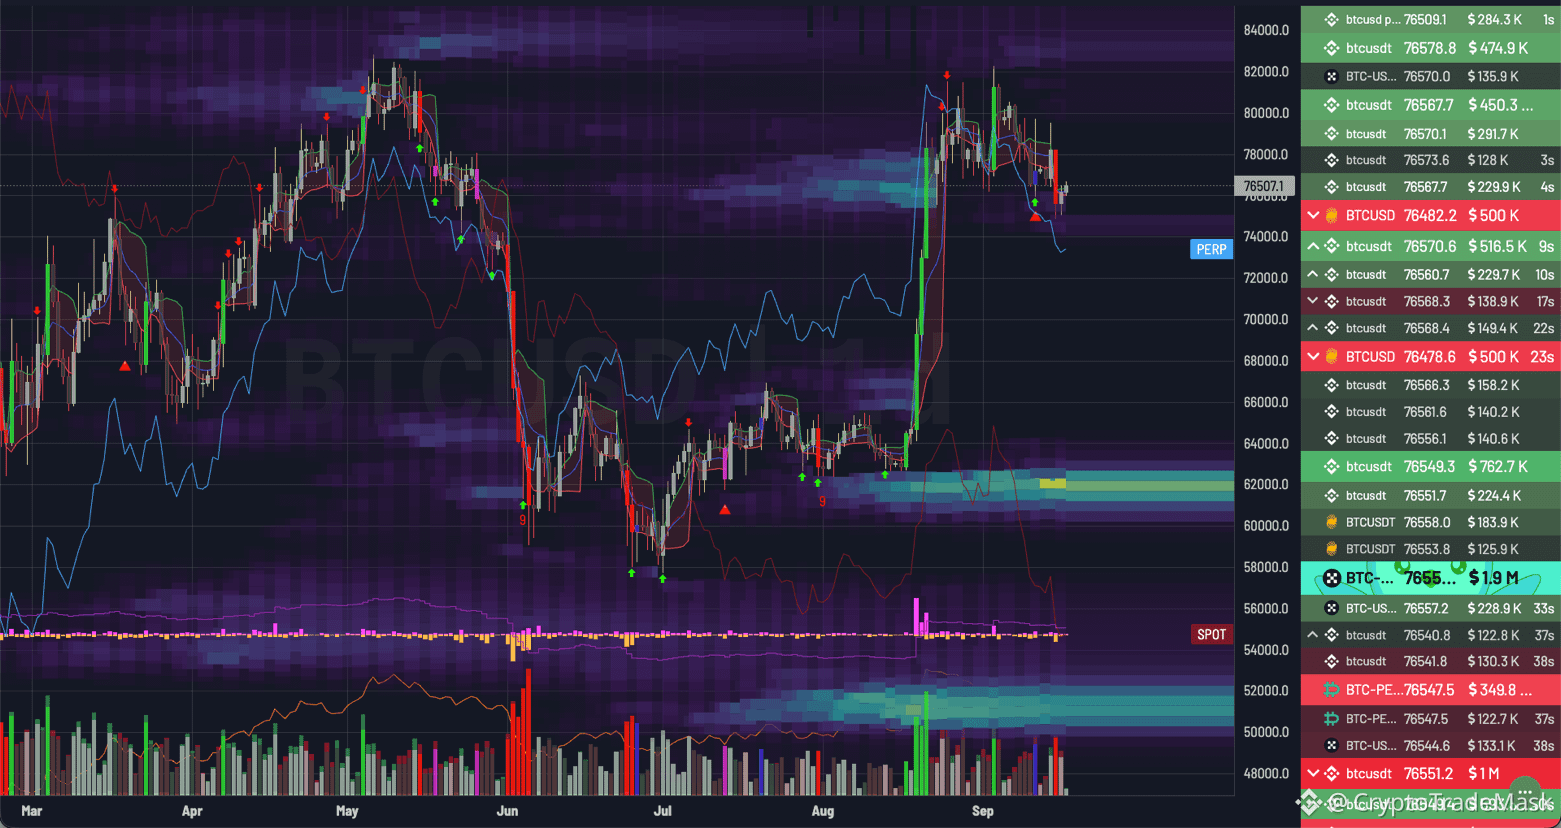
Absorption of the dump: After a sharp drop from the $82,000–$84,000 range, the price established a local bottom at $74,000; here, a major player fully absorbed the panic selling and swept up long-position liquidations.
Current status: Bitcoin is currently trading within a tight range of $76,480–$76,580.
Heatmap & Volume: A dense wall of limit buy orders has formed in the $75,600–$76,000 zone. The market is actively building momentum ahead of the next volatility spike.
🎯 Key Levels
Support: $74,000–$75,000 (primary line of defense for buyers)
Resistance: $78,000–$78,800 (level that must be broken to return to the $80k+ range)
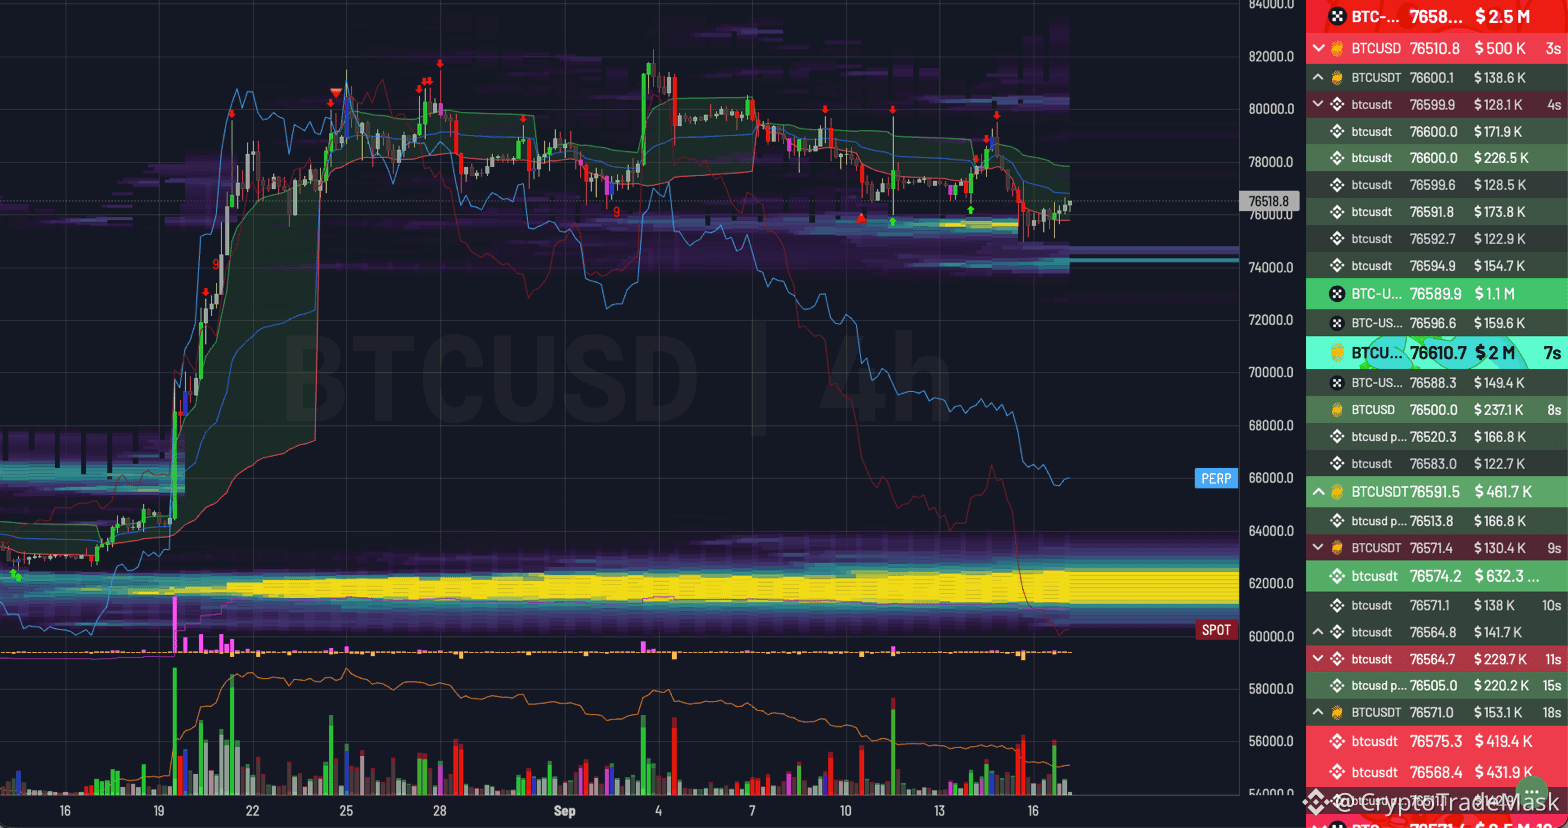
Global risk zone: $60,000–$62,000 (major volume block; the target if the $74,000 level fails to hold)
🎯 Conclusion and Scenarios
Despite significant political and macroeconomic headwinds, sellers failed to break the $74,000 level. This indicates the presence of a strong institutional spot buyer.
📈 Base case: Consolidation within the $75,000–$78,500 range. Establishing a position above $78,800 would pave the way back to $80,000+.
📉 Bearish scenario: Losing the $74,000 level would send the price searching for a bottom in the high-volume zone around $62,000.
⚠️ Summary: As long as the $75,000 level holds, the priority remains accumulation and a local rebound. Trade the range boundaries and don't forget your stop-loss orders!
🔥 $BTC /USD: Analysis Following the Political Storm
The US Senate rejected the Clarity Act (49–50), and the macroeconomic backdrop is unsettling the market with the prospect of sustained high interest rates. One might have expected a massive panic sell-off. Yet, what does the chart show?
The market has proven once again: liquidity is king.
📊 What is happening on the chart?
Absorption of the dump: After a sharp drop from the $82,000–$84,000 range, the price established a local bottom at $74,000; here, a major player fully absorbed the panic selling and swept up long-position liquidations.
Current status: Bitcoin is currently trading within a tight range of $76,480–$76,580.
Heatmap & Volume: A dense wall of limit buy orders has formed in the $75,600–$76,000 zone. The market is actively building momentum ahead of the next volatility spike.
🎯 Key Levels
Support: $74,000–$75,000 (primary line of defense for buyers)
Resistance: $78,000–$78,800 (level that must be broken to return to the $80k+ range)
Global risk zone: $60,000–$62,000 (major volume block; the target if the $74,000 level fails to hold)
🎯 Conclusion and Scenarios
Despite significant political and macroeconomic headwinds, sellers failed to break the $74,000 level. This indicates the presence of a strong institutional spot buyer.
📈 Base case: Consolidation within the $75,000–$78,500 range. Establishing a position above $78,800 would pave the way back to $80,000+.
📉 Bearish scenario: Losing the $74,000 level would send the price searching for a bottom in the high-volume zone around $62,000.
⚠️ Summary: As long as the $75,000 level holds, the priority remains accumulation and a local rebound. Trade the range boundaries and don't forget your stop-loss orders!